Portfolio Risk Analytics
Client
Moody’s Analytics
Completion Date
2022 - Ongoing
My Role
UI/UX
Overview
The Portfolio Risk Analytics software is a multi-purpose numerical simulation and analysis tool. It uses stochastic economic scenarios, such as those created by the Moody’s Analytics Economic Scenario Generator software, to calculate forward-looking measures of risk and performance for multi-asset investment portfolios.
The users
Users such as Pension, Insurance and Investment managers at companies like Santander, Schroders and Lloyds International can enter their asset and liability data into the tool and then run it against our scenario data to create projections which forecast possible future financial outcomes. They would then look for a favourable outcome and adjust the asset allocations of their actual funds to match.
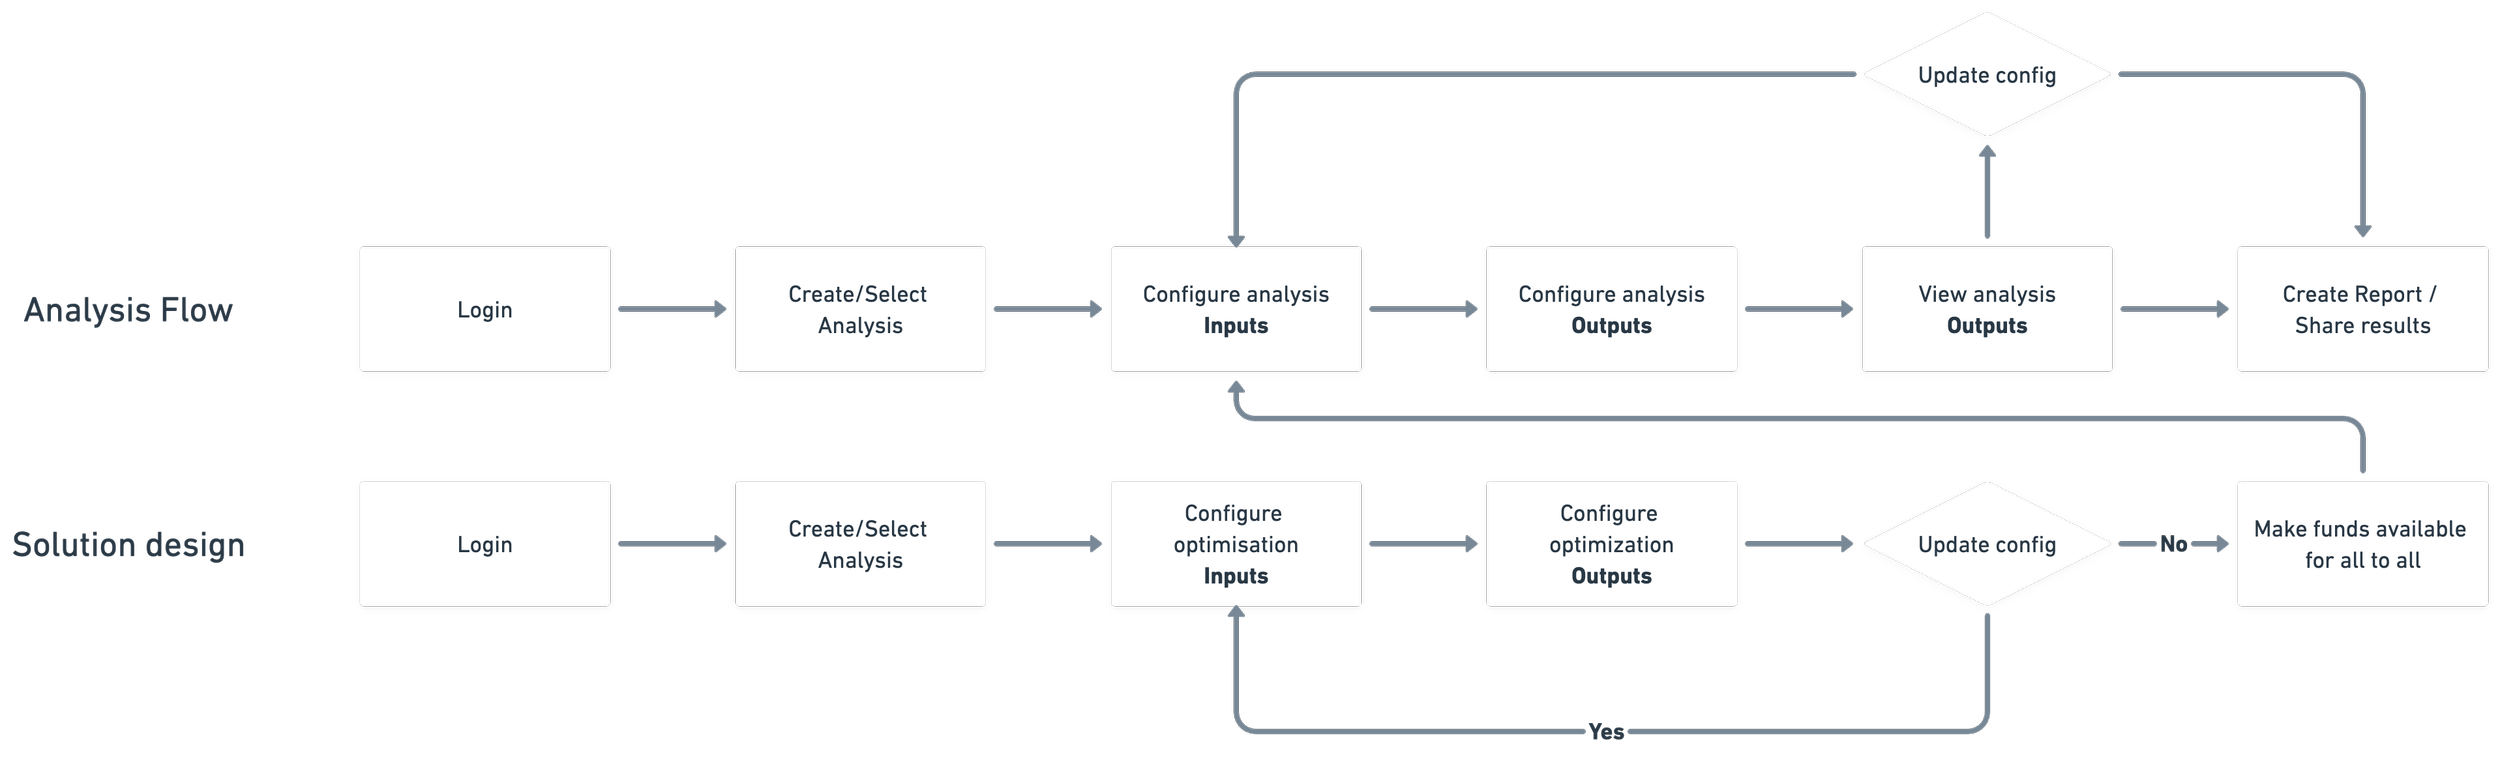
User types
New analysis: User would enter their data into a new project, configure and then run a projection to forecast
Repeat analysis: User would enter an existing project to view past results, run a new projection against updated data or adjust existing data.
Optimise: Using the Optimizer tool to create funds based on stochastic data that can be chosen for use here or elsewhere in other tools.
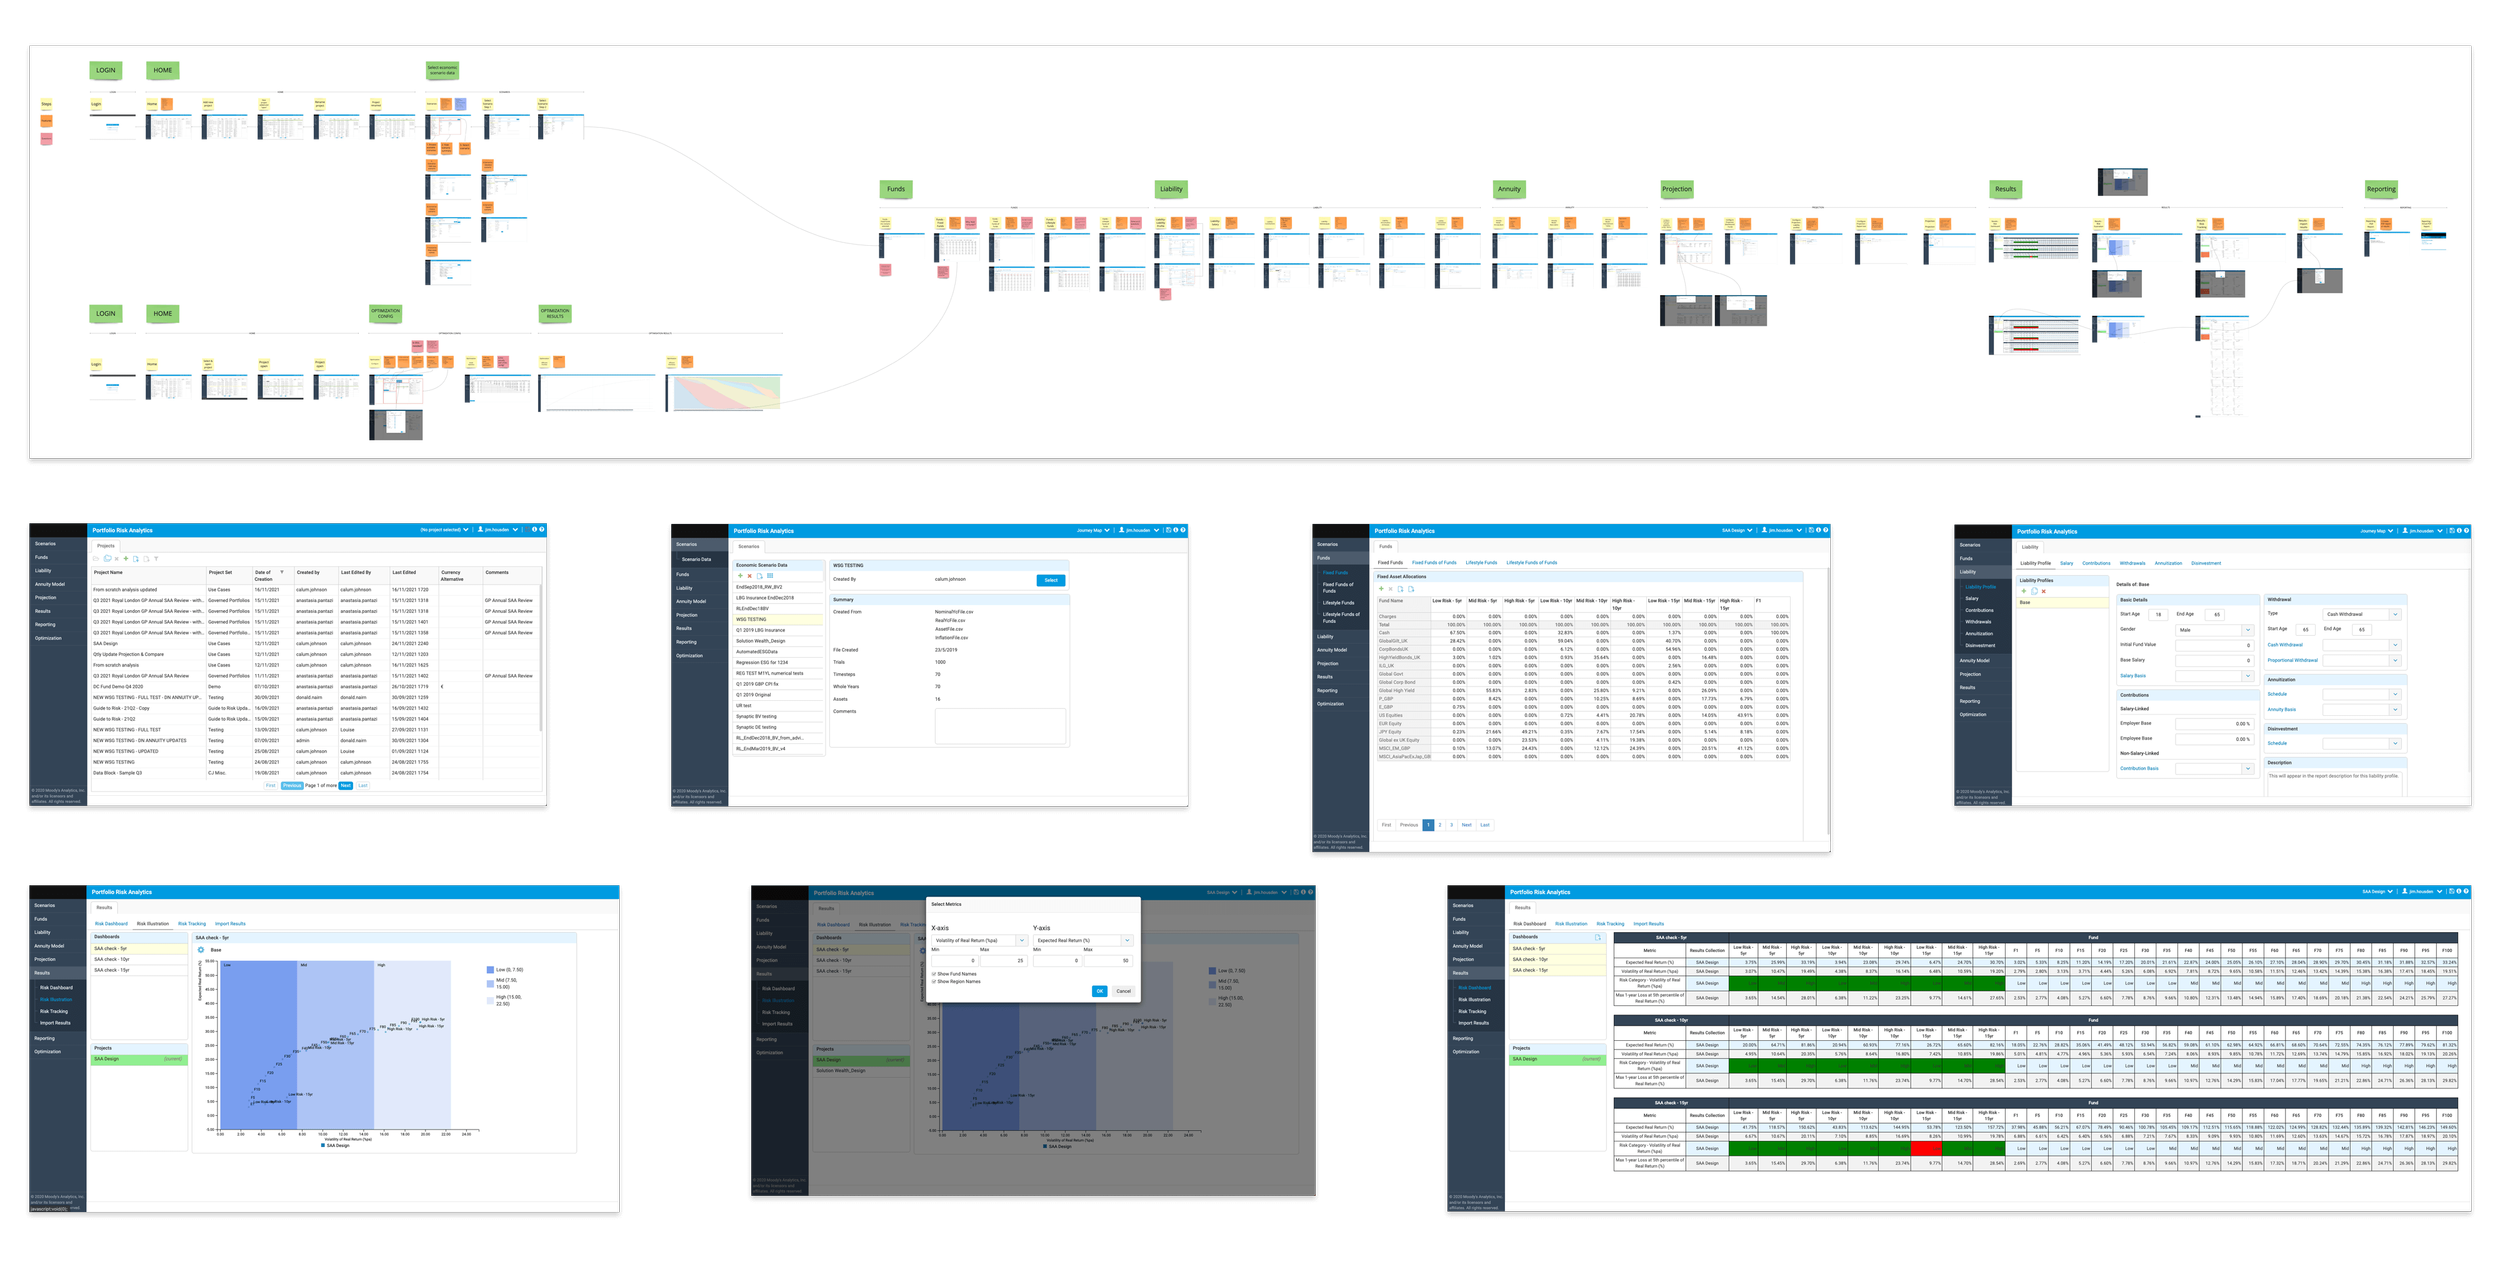
Existing platform
The existing platform was several years old and need of a major overhaul. There was a confusing nav and UX which had users jumping from one section to another in a non logical flow.
The initial plan was to just reskin the platform in the Osiris design system, but as the work progressed it became apparent that the UX had to addressed.
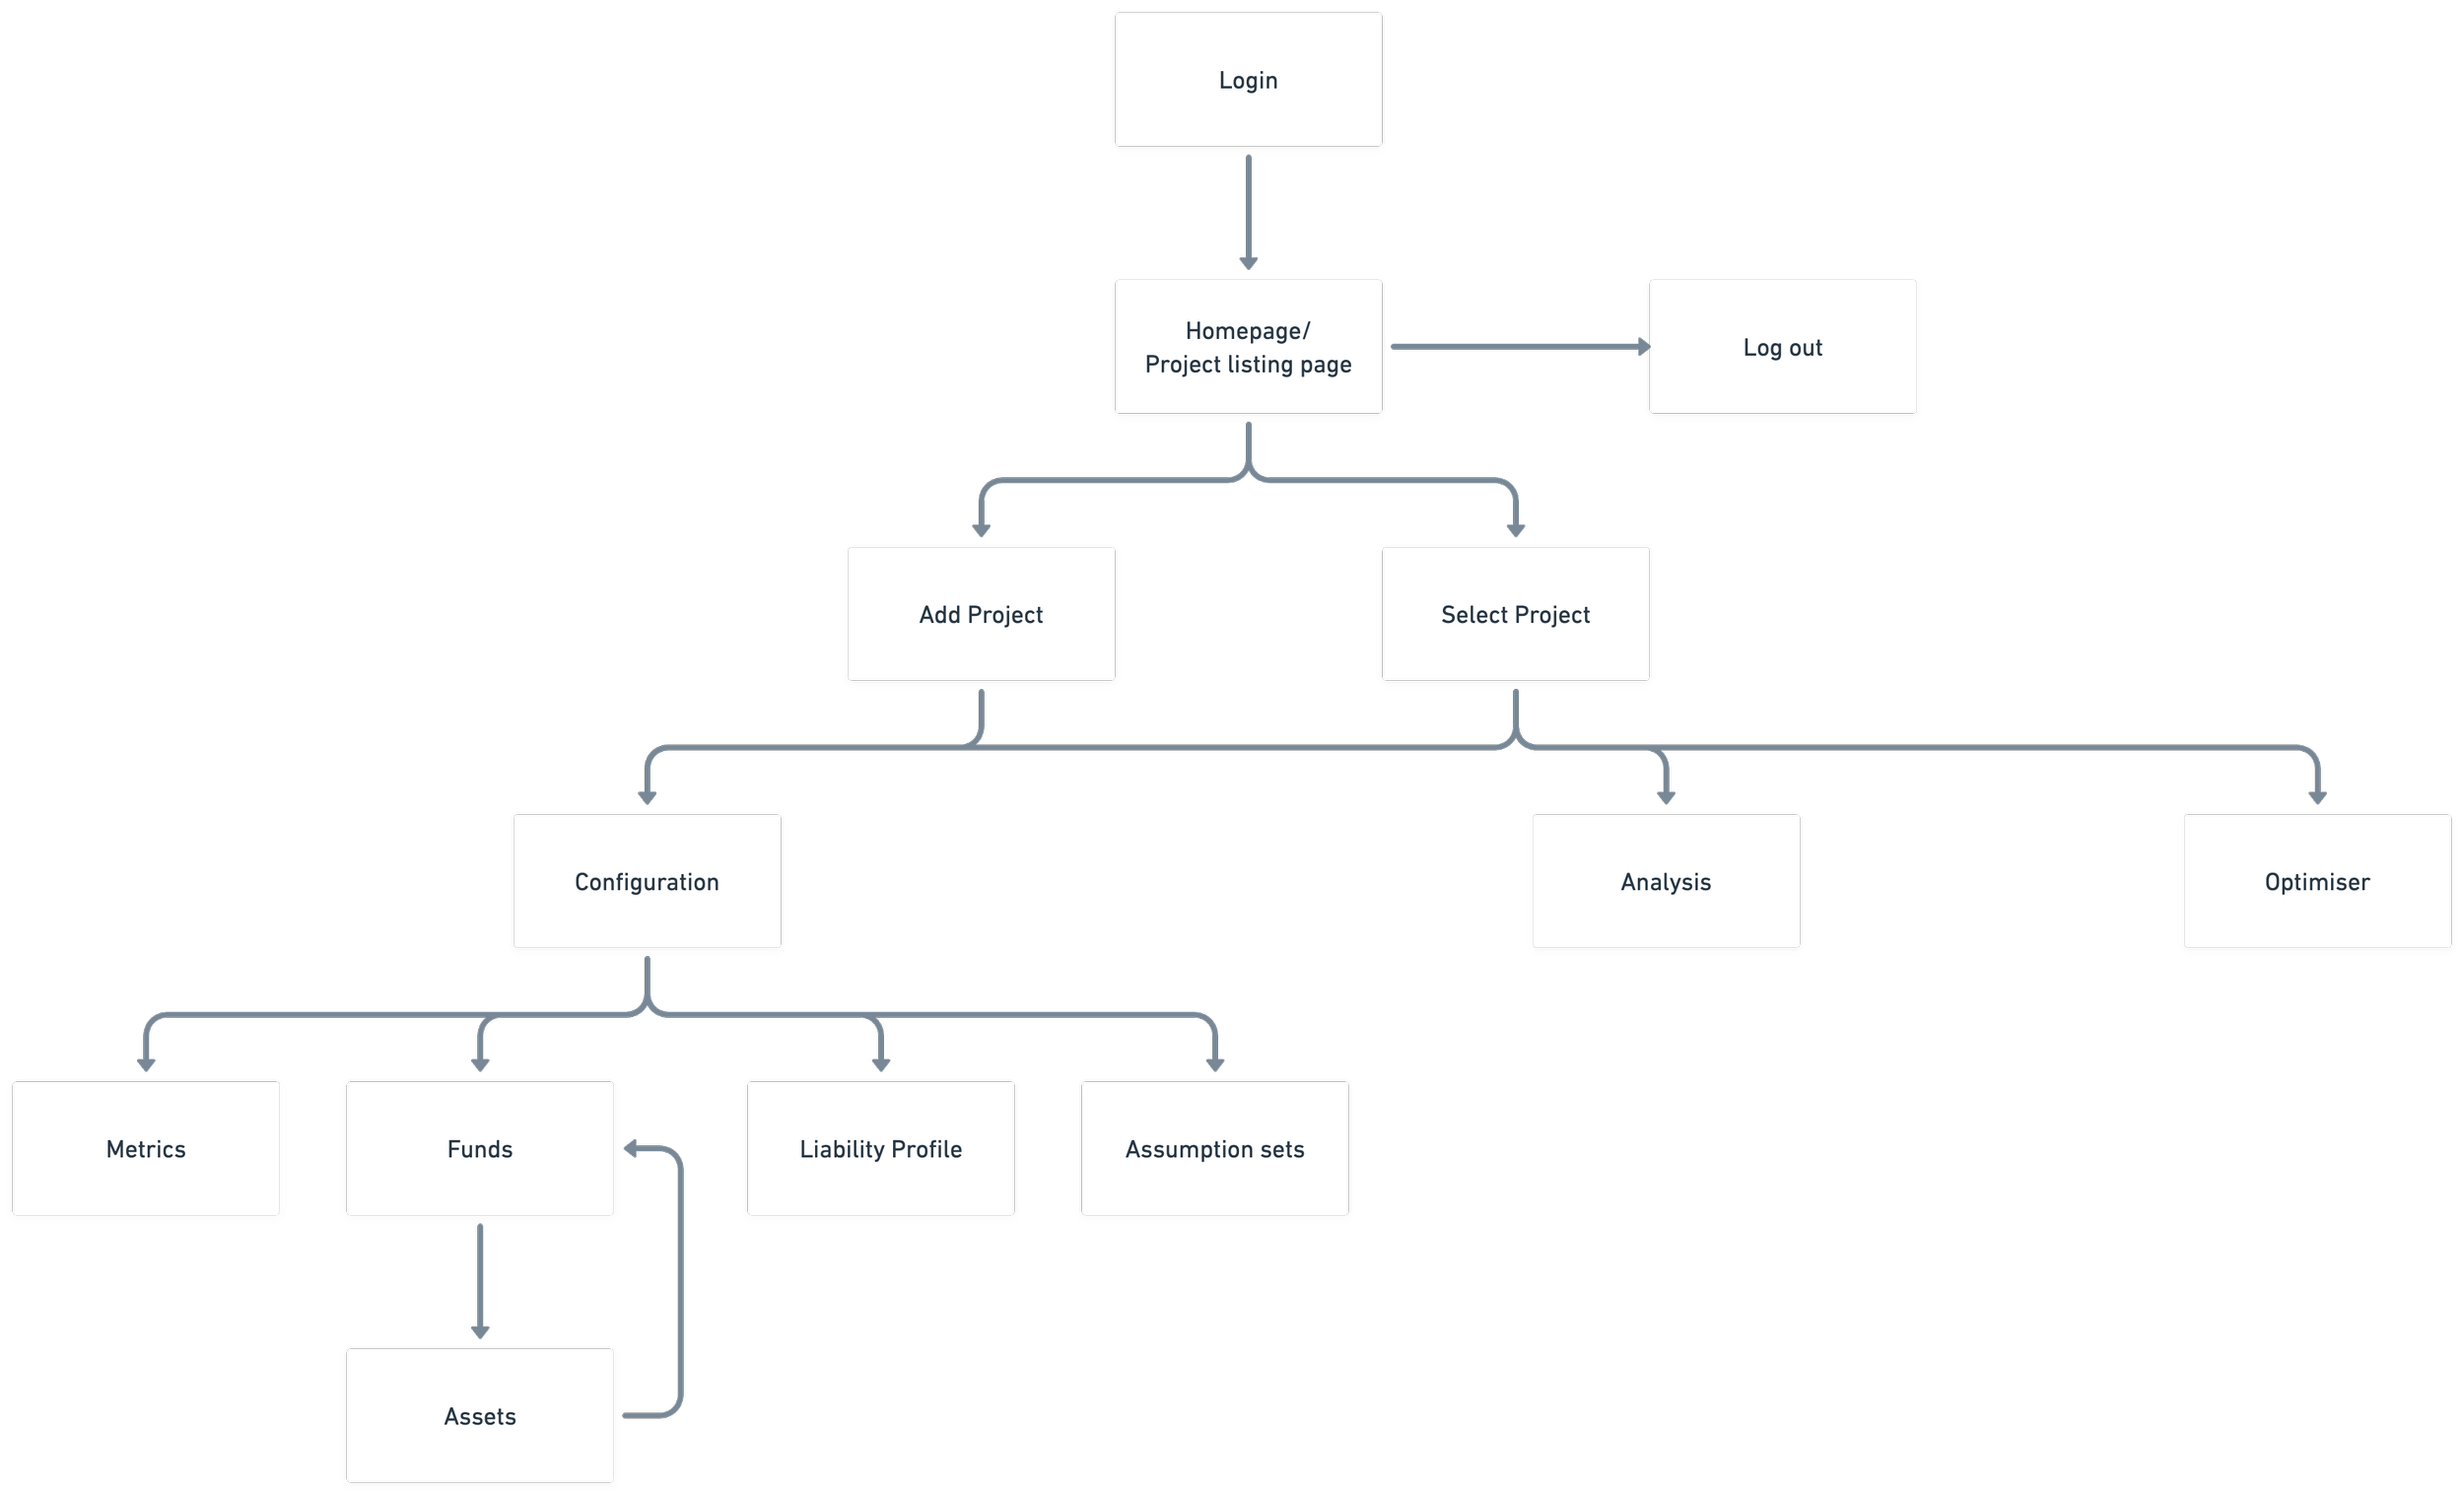
Once we established a map of the goals that our users were aiming for when using our product, we started working out the intricacies of all the different parts of the site. This took a lot of time as there was a lot complexities we didn’t account for when redesigning the UX.
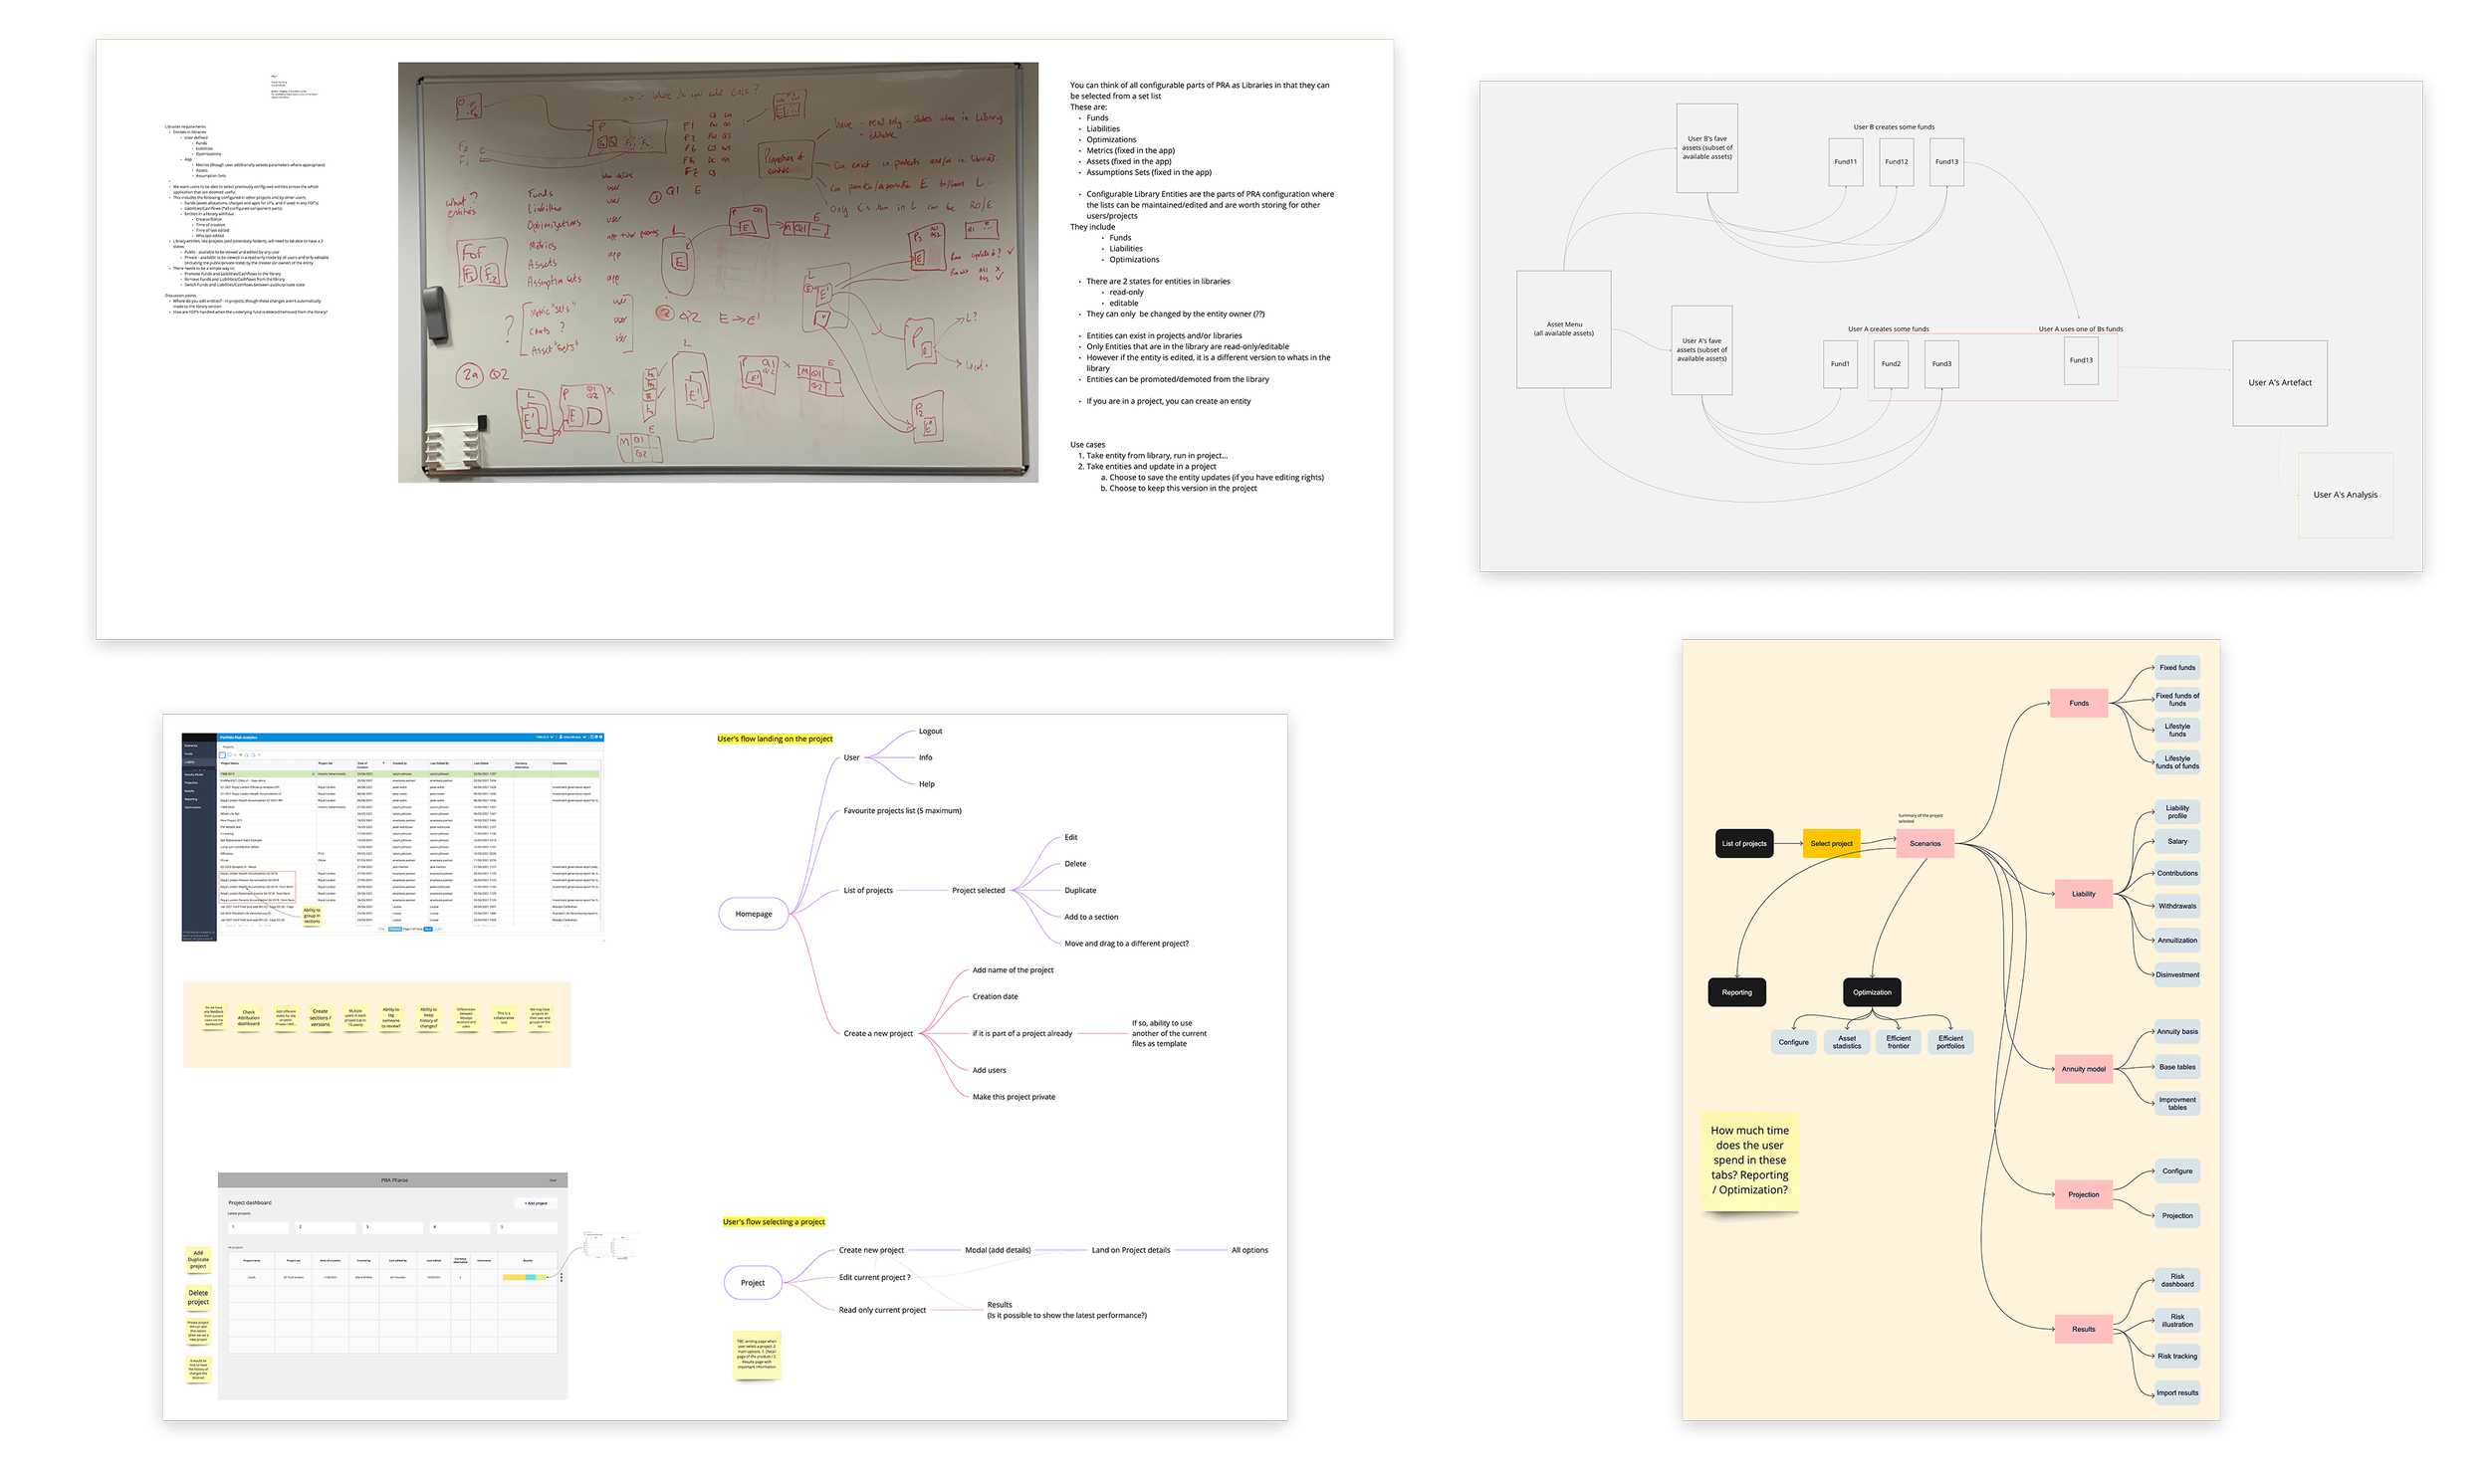
The top-level site map allowed us to start breaking down the project into stories and establish our milestones.
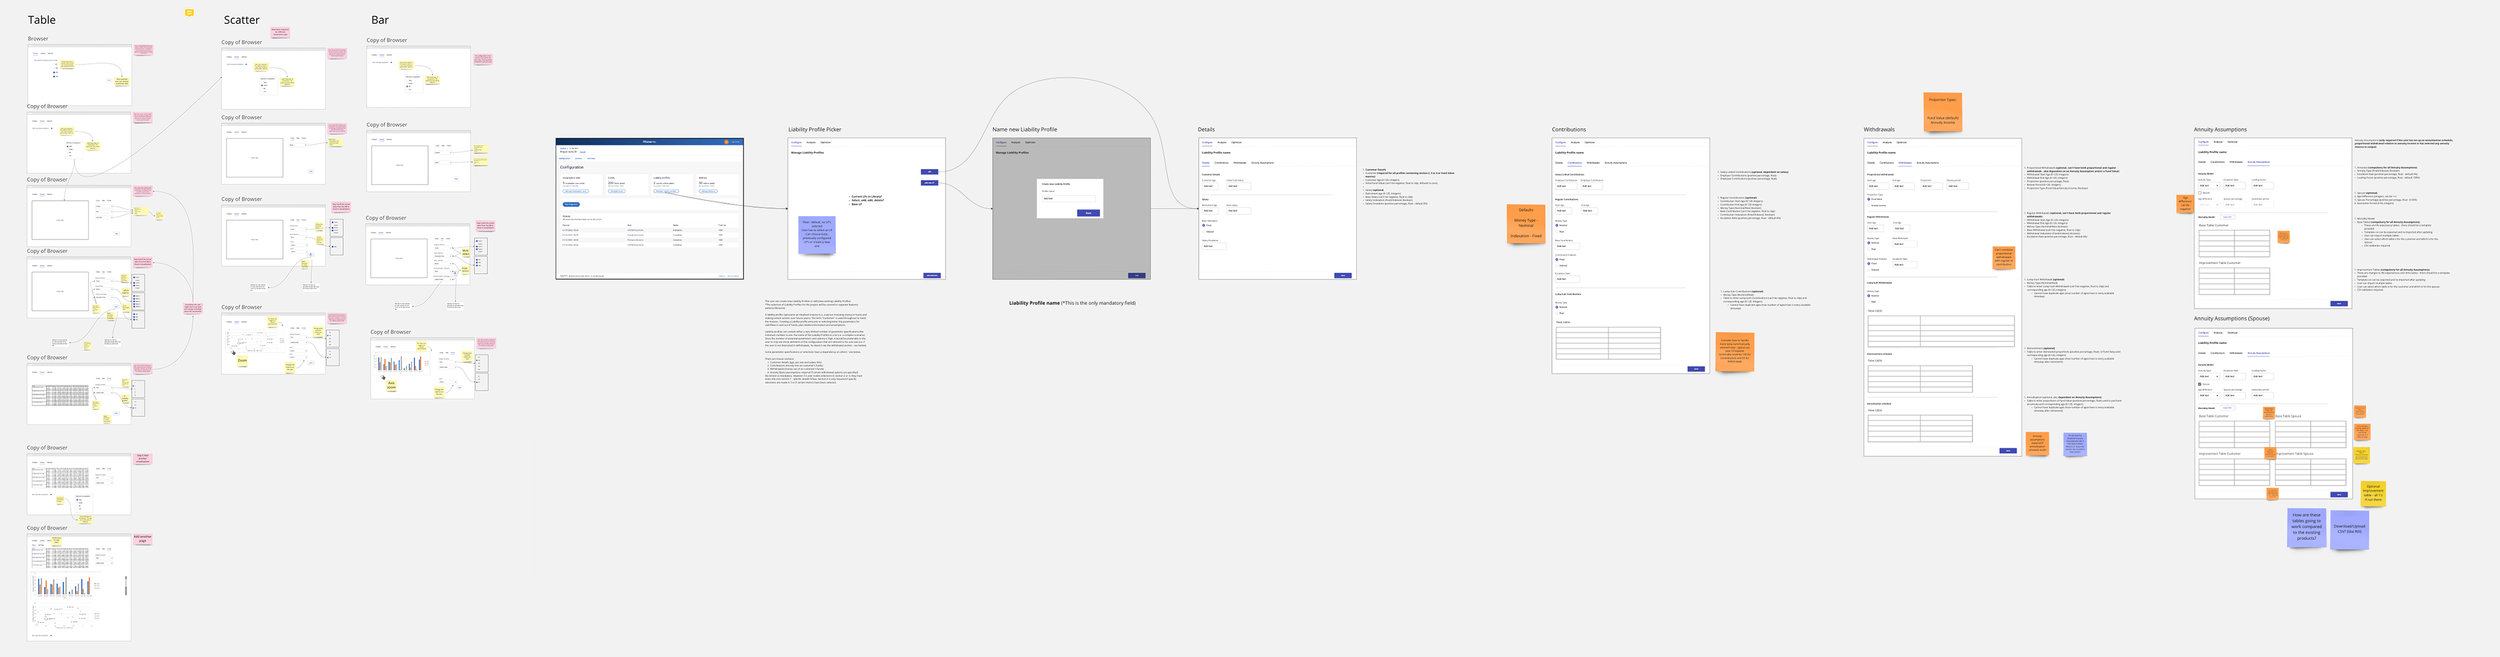
Wireframing
Taking the initial low fidelity wireframes we created as a team, I started transforming them into something more concreate and understandable when presenting our progress to the team and the wider business.
Design solutions
Once we had established the wireframes we were happy with. I started working on the designs. Collaborating with the rest of the design team, I made sure the designs I produced was consistent and worked with them when producing new components.
Although no user-testing was done during this project, we did present the initial designs and concepts to several key clients, to gauge their responses and take on any feedback. Using their comments, we were able to pivot and make changes where necessary.
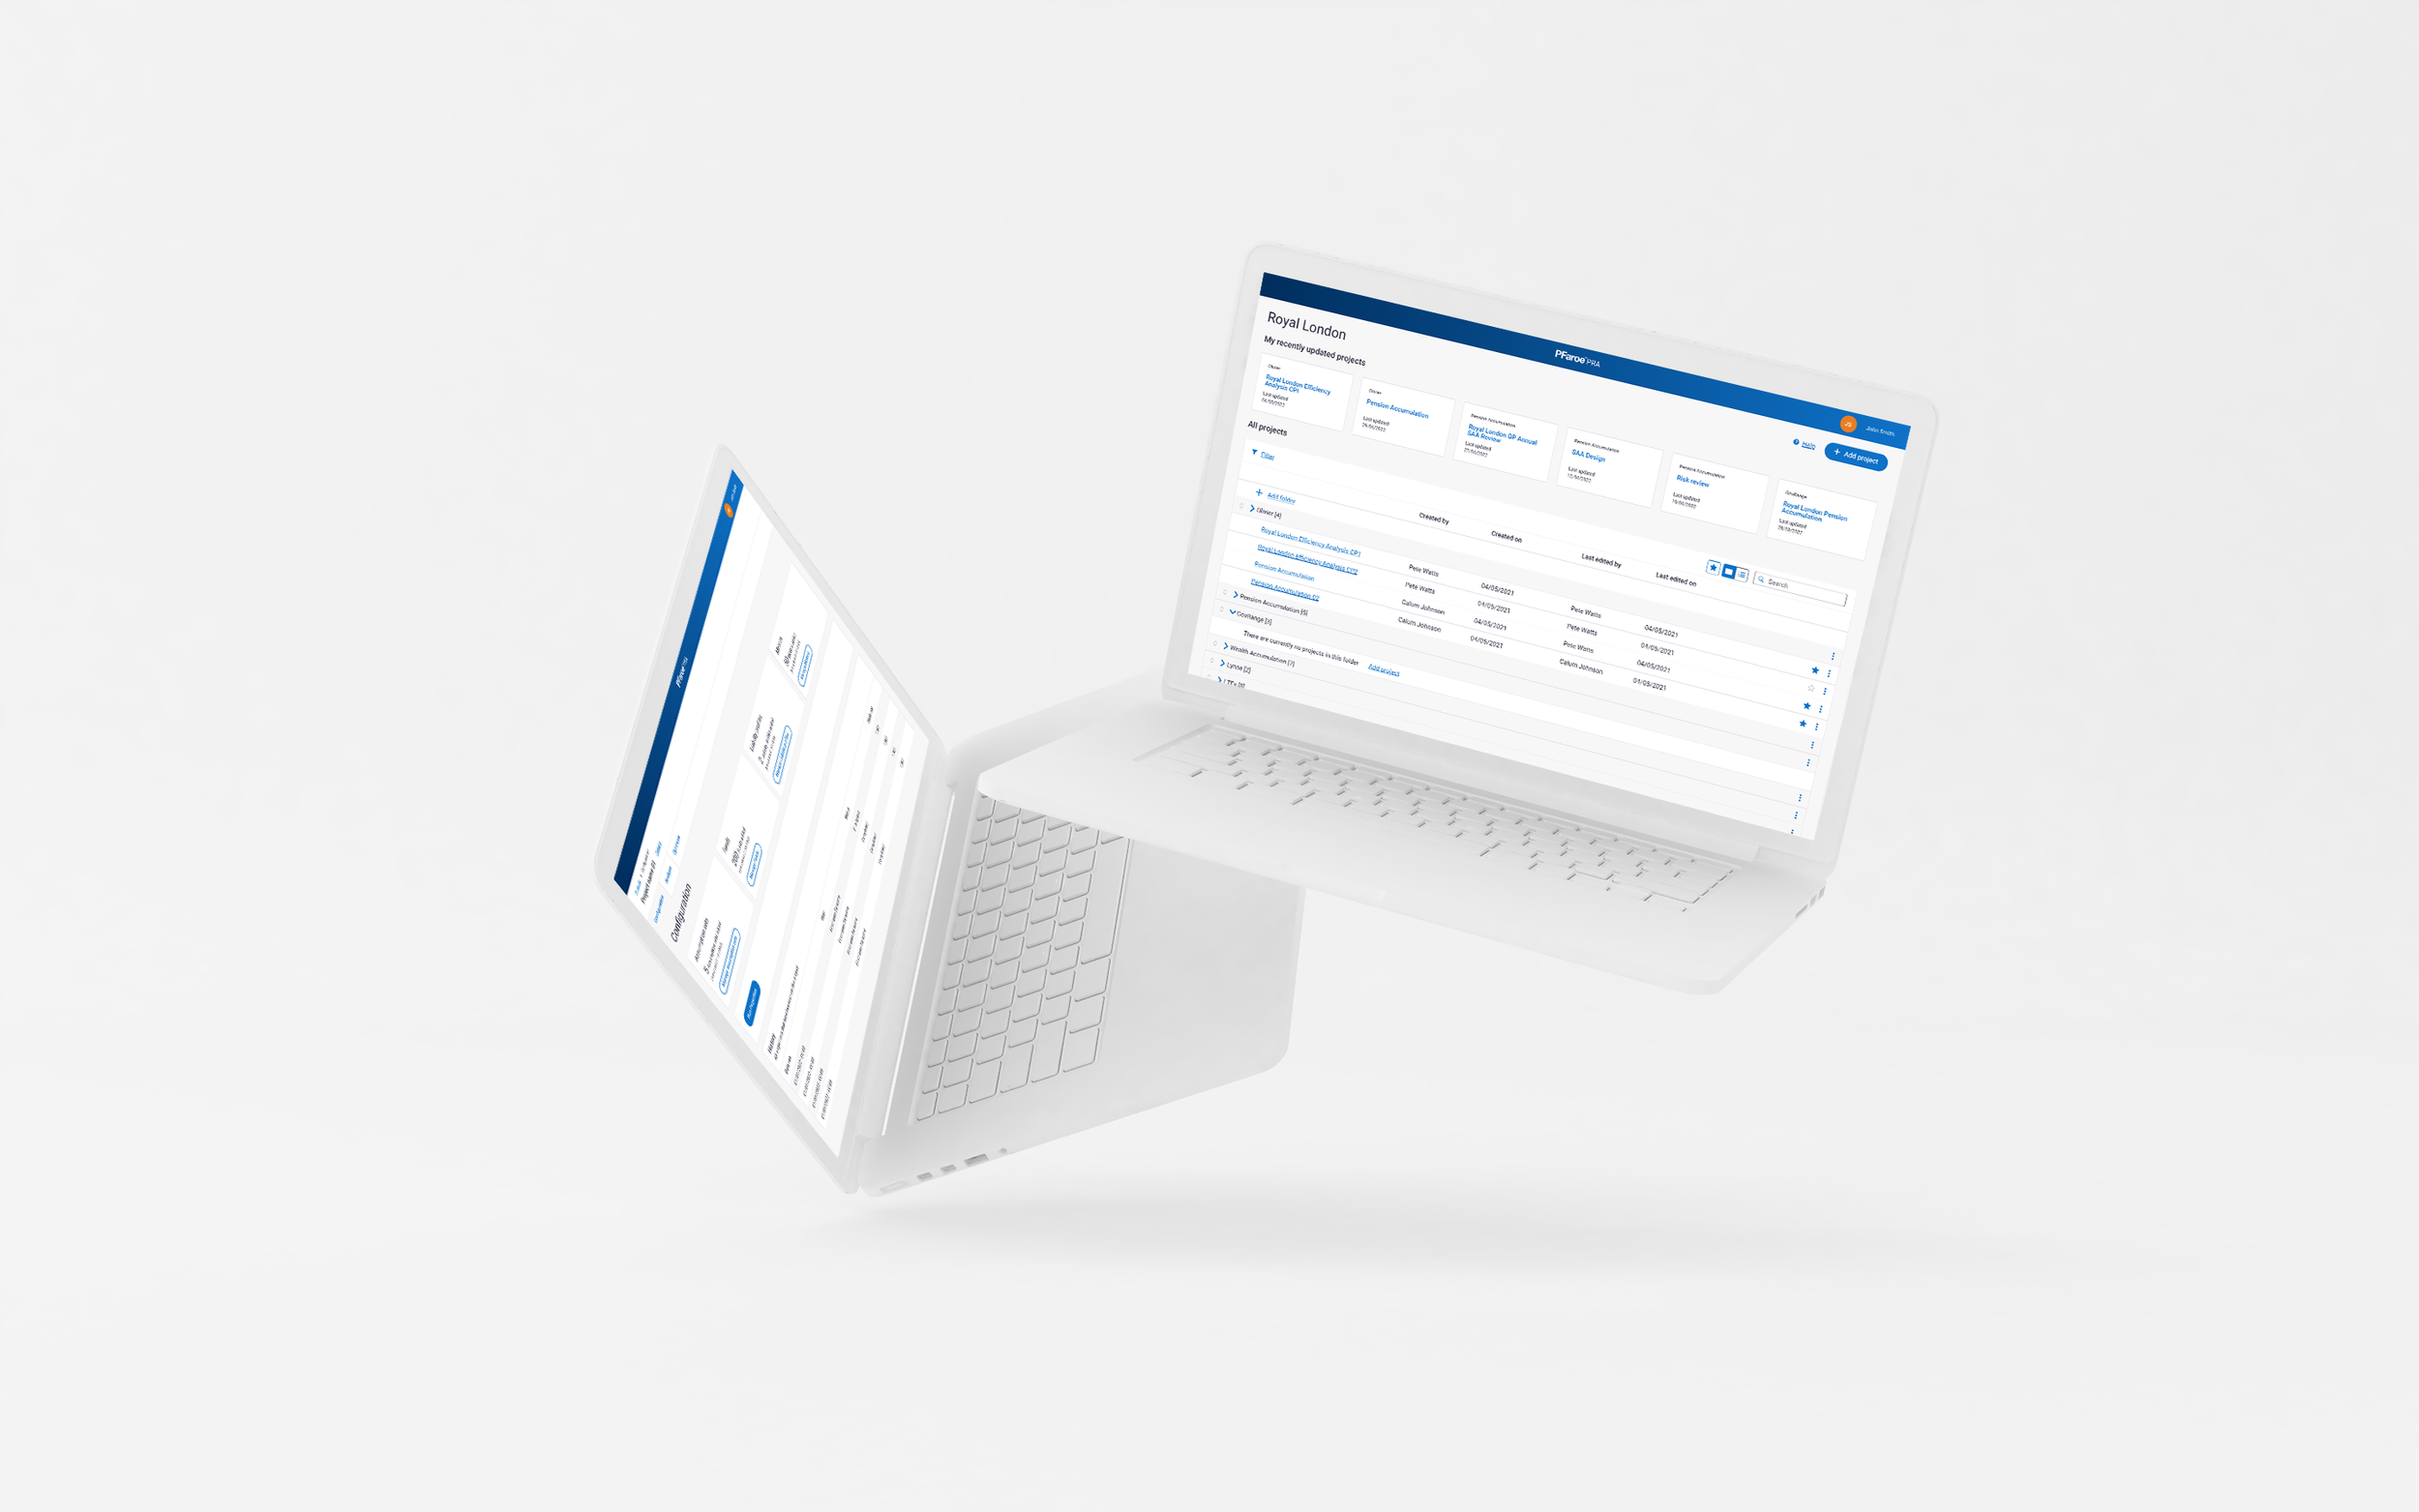
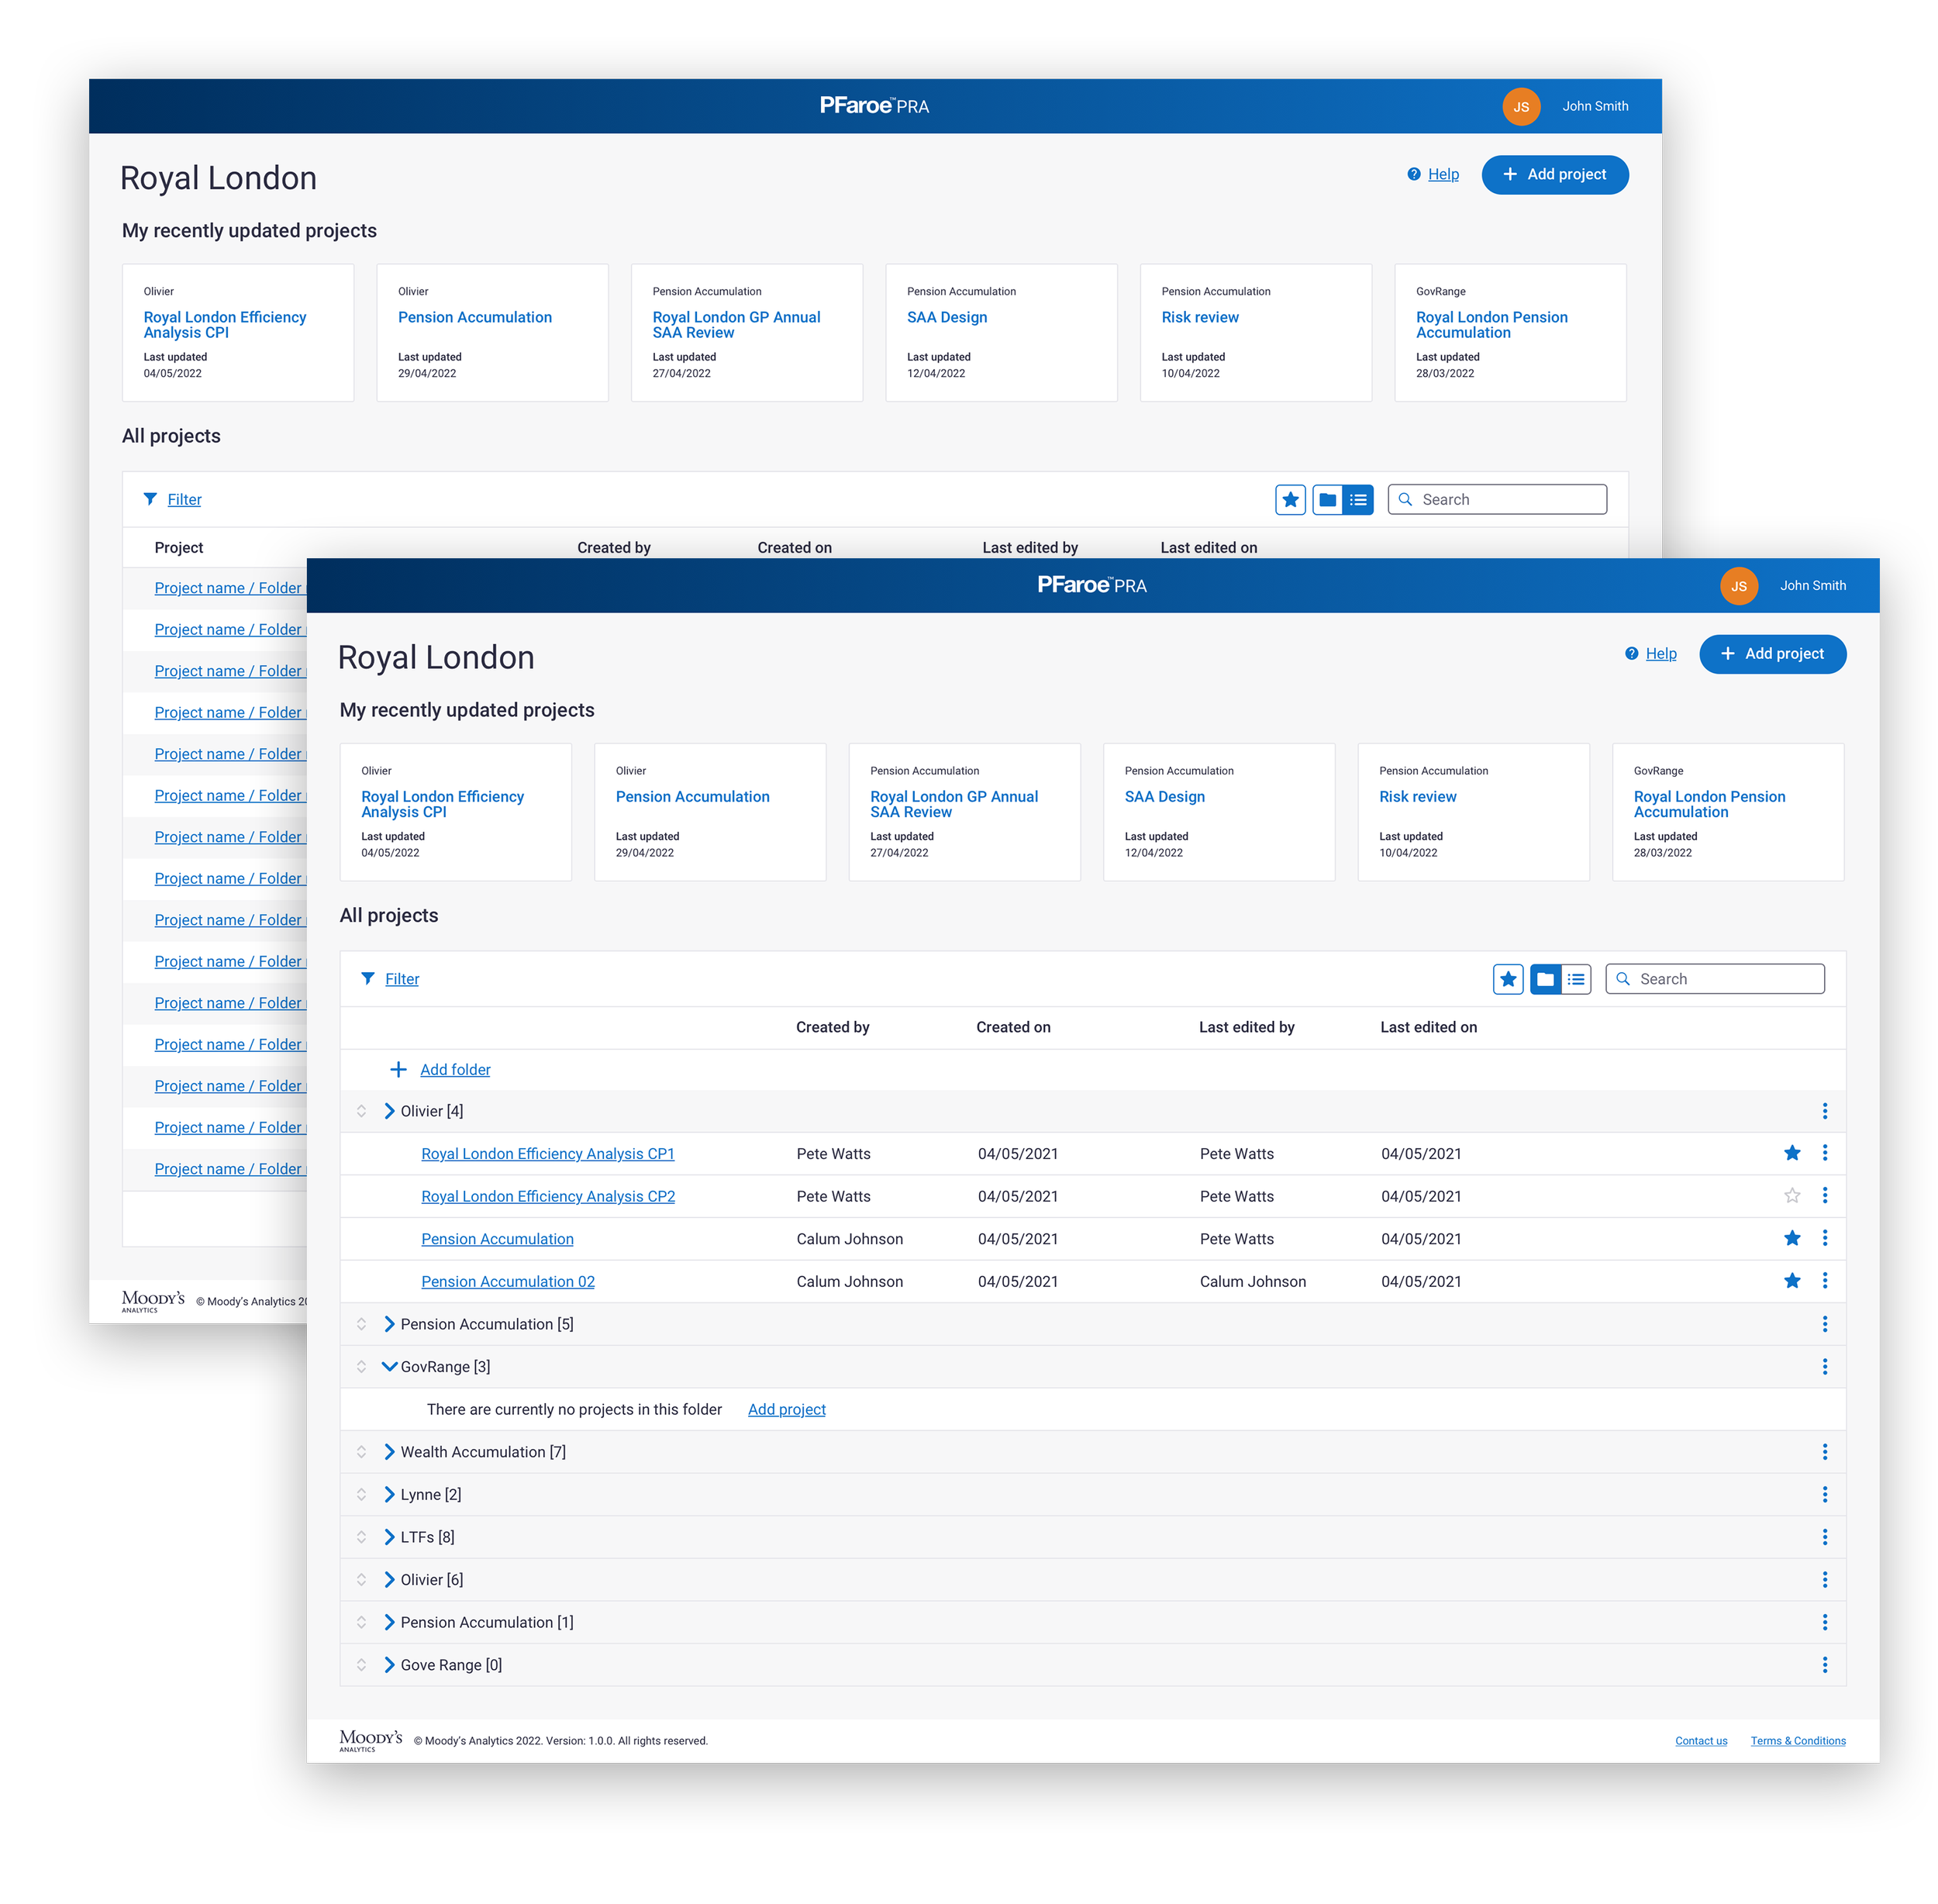
Homepage / Project listing
This page was important to get right as it what caused a lot of issues in the existing version of the product.
Users had to be able to quickly select their projects they were working on, and organise them in a way which made it easier for them and their team members to find, so favoriting and showing recently updated projects were key.
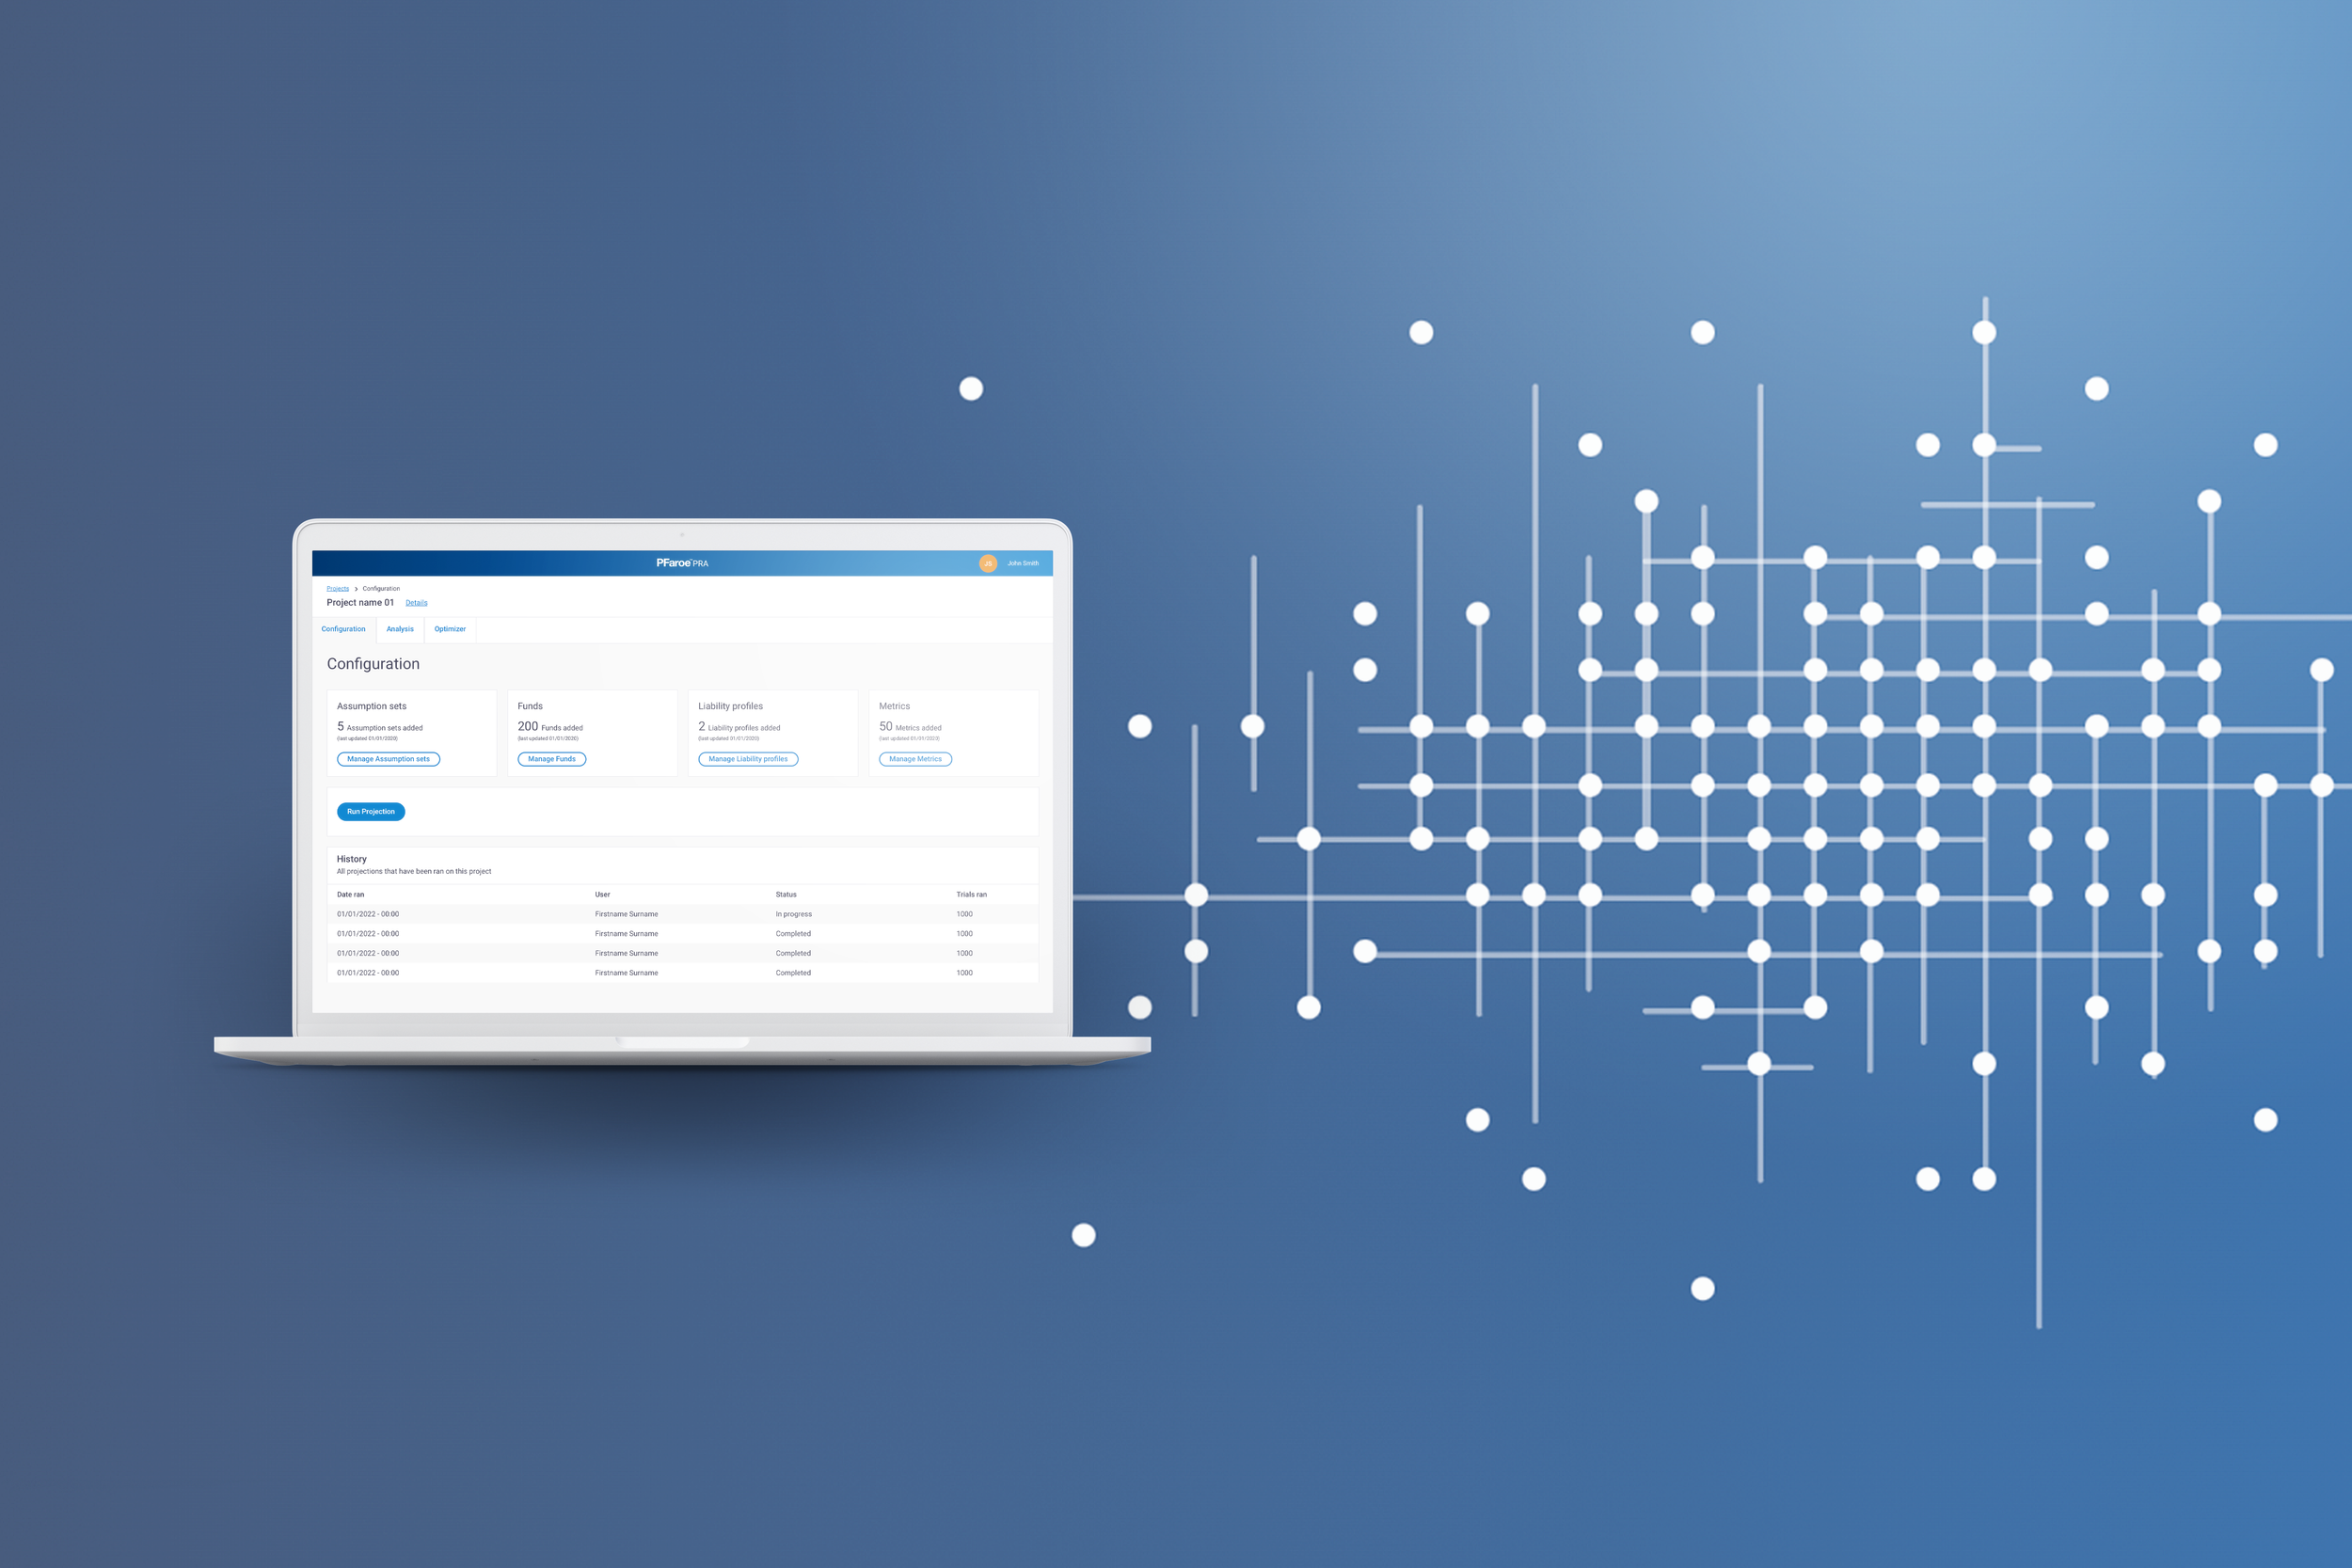
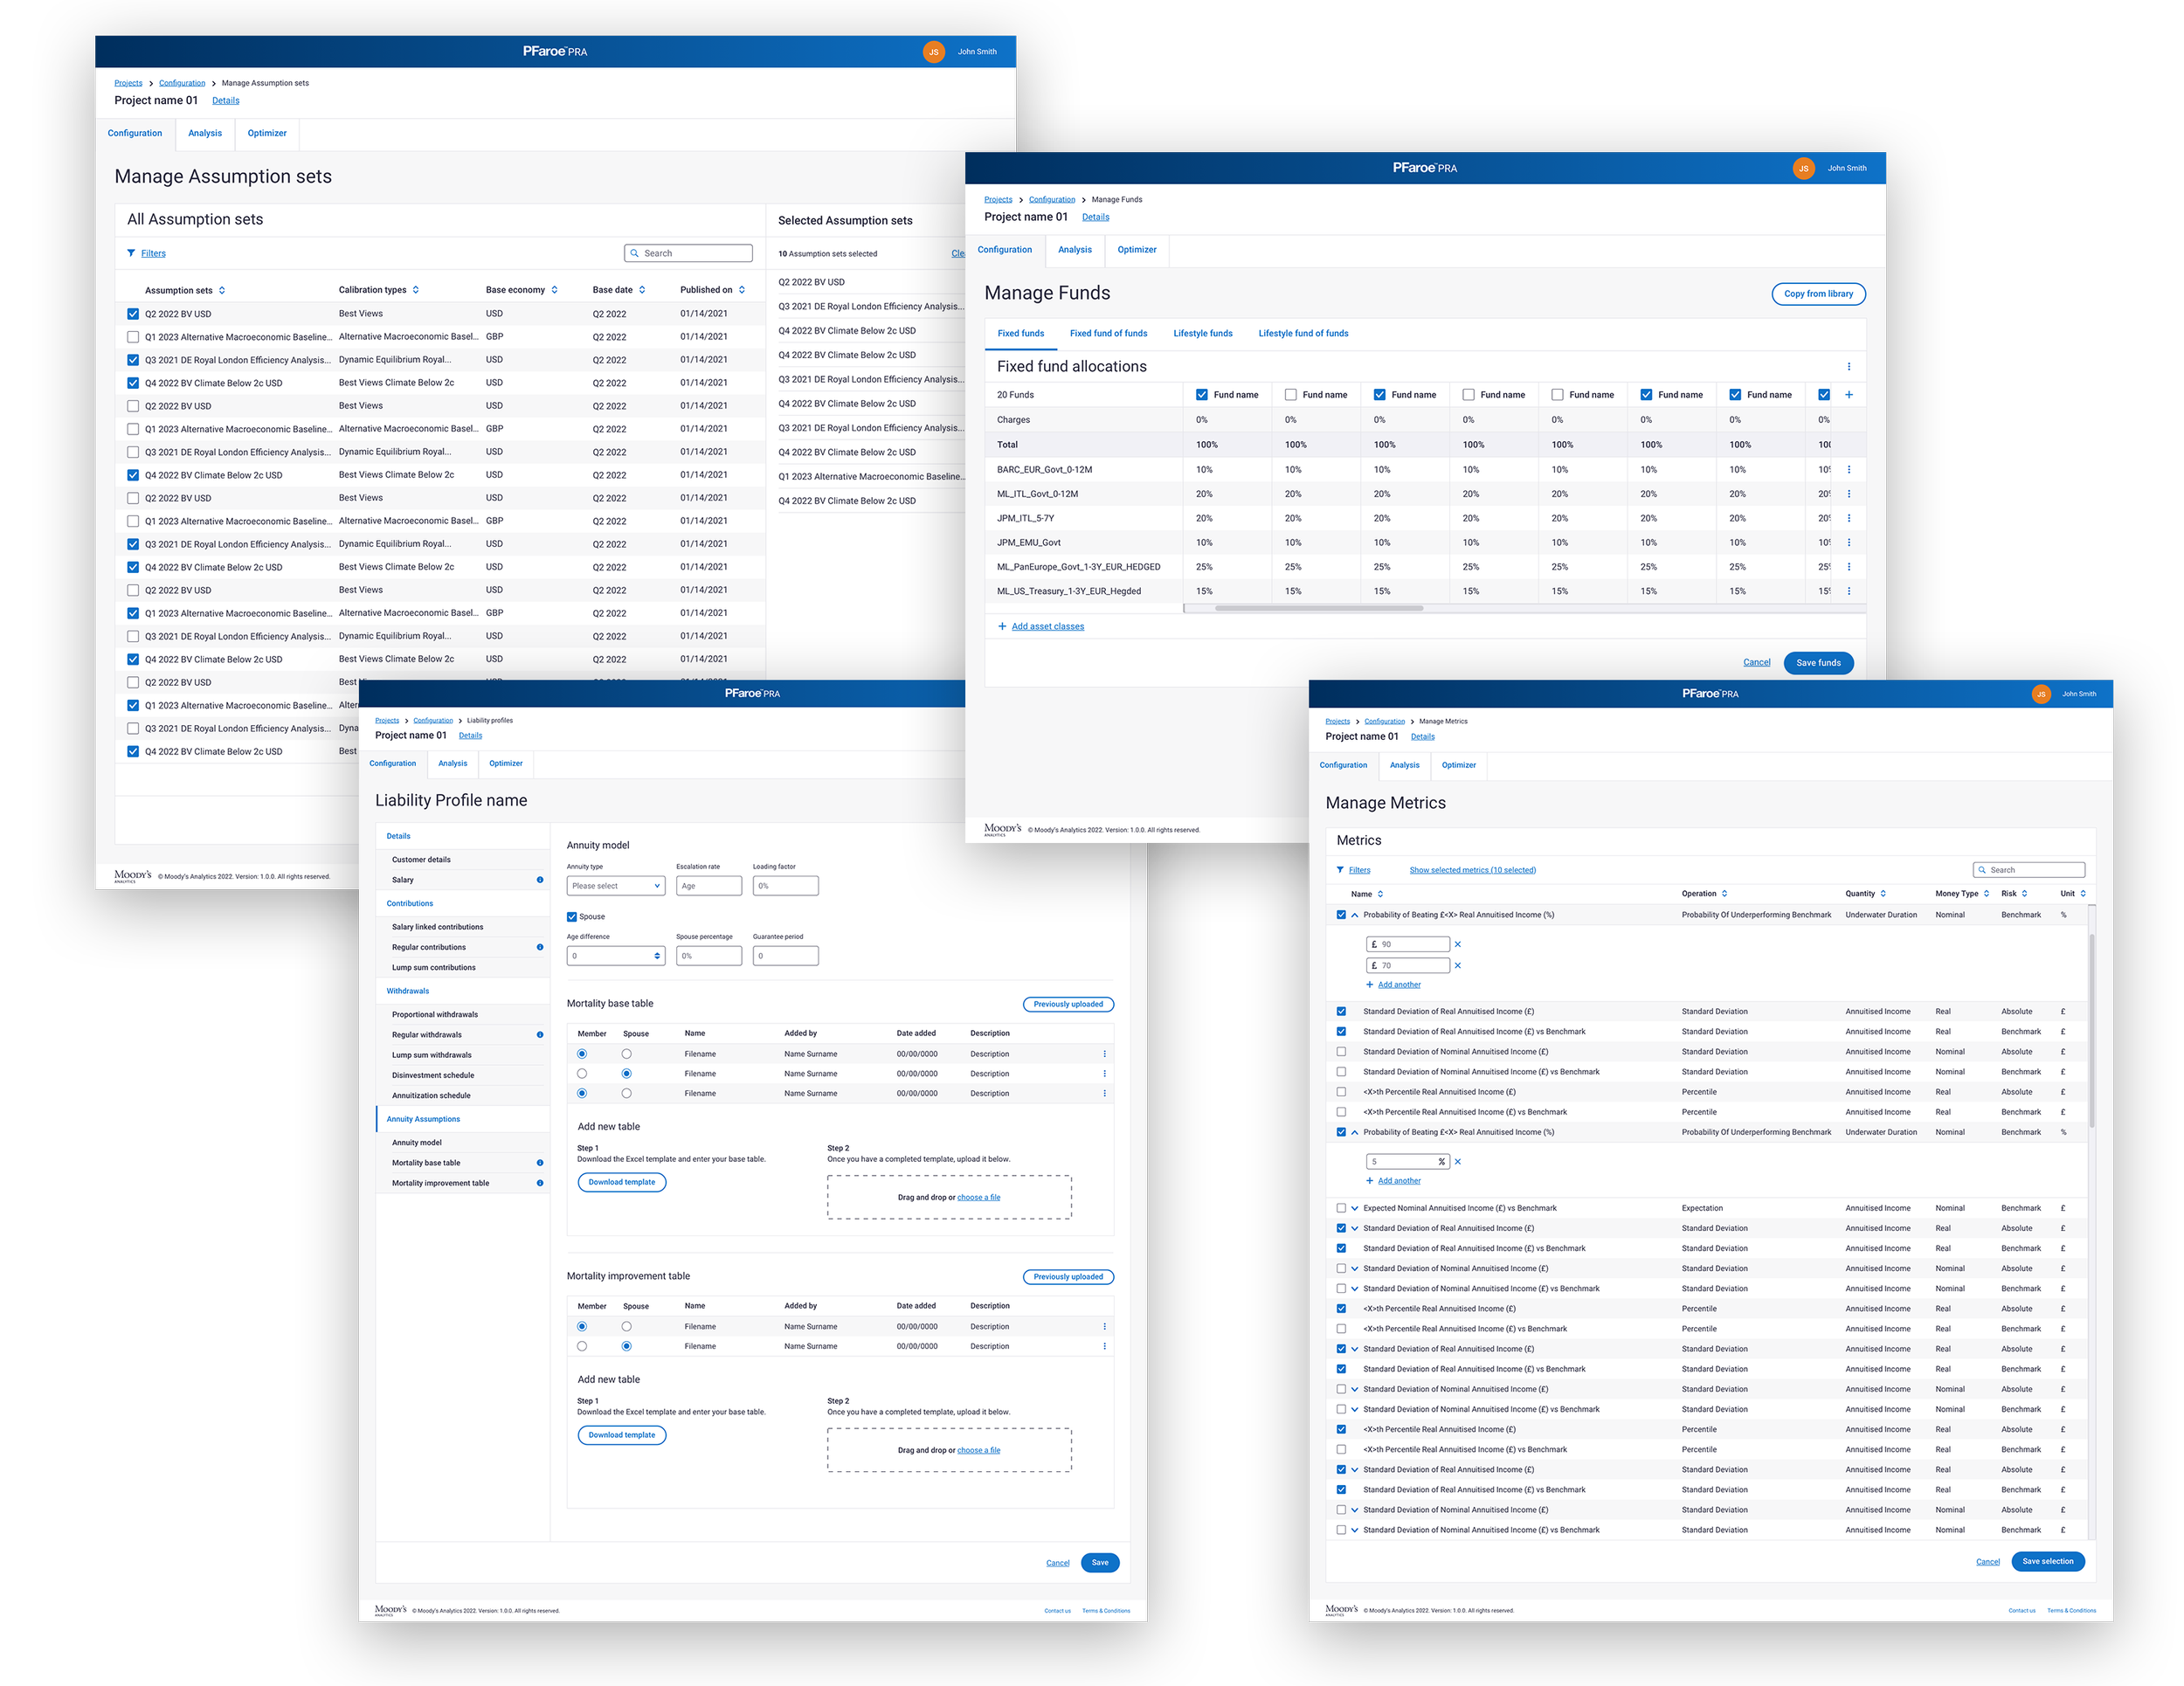
Configuration
The configuration is central to setting up a project in PRA. They would add their Assumptions sets, Funds, Liability profiles and Metrics, which would allow them to run a projection.
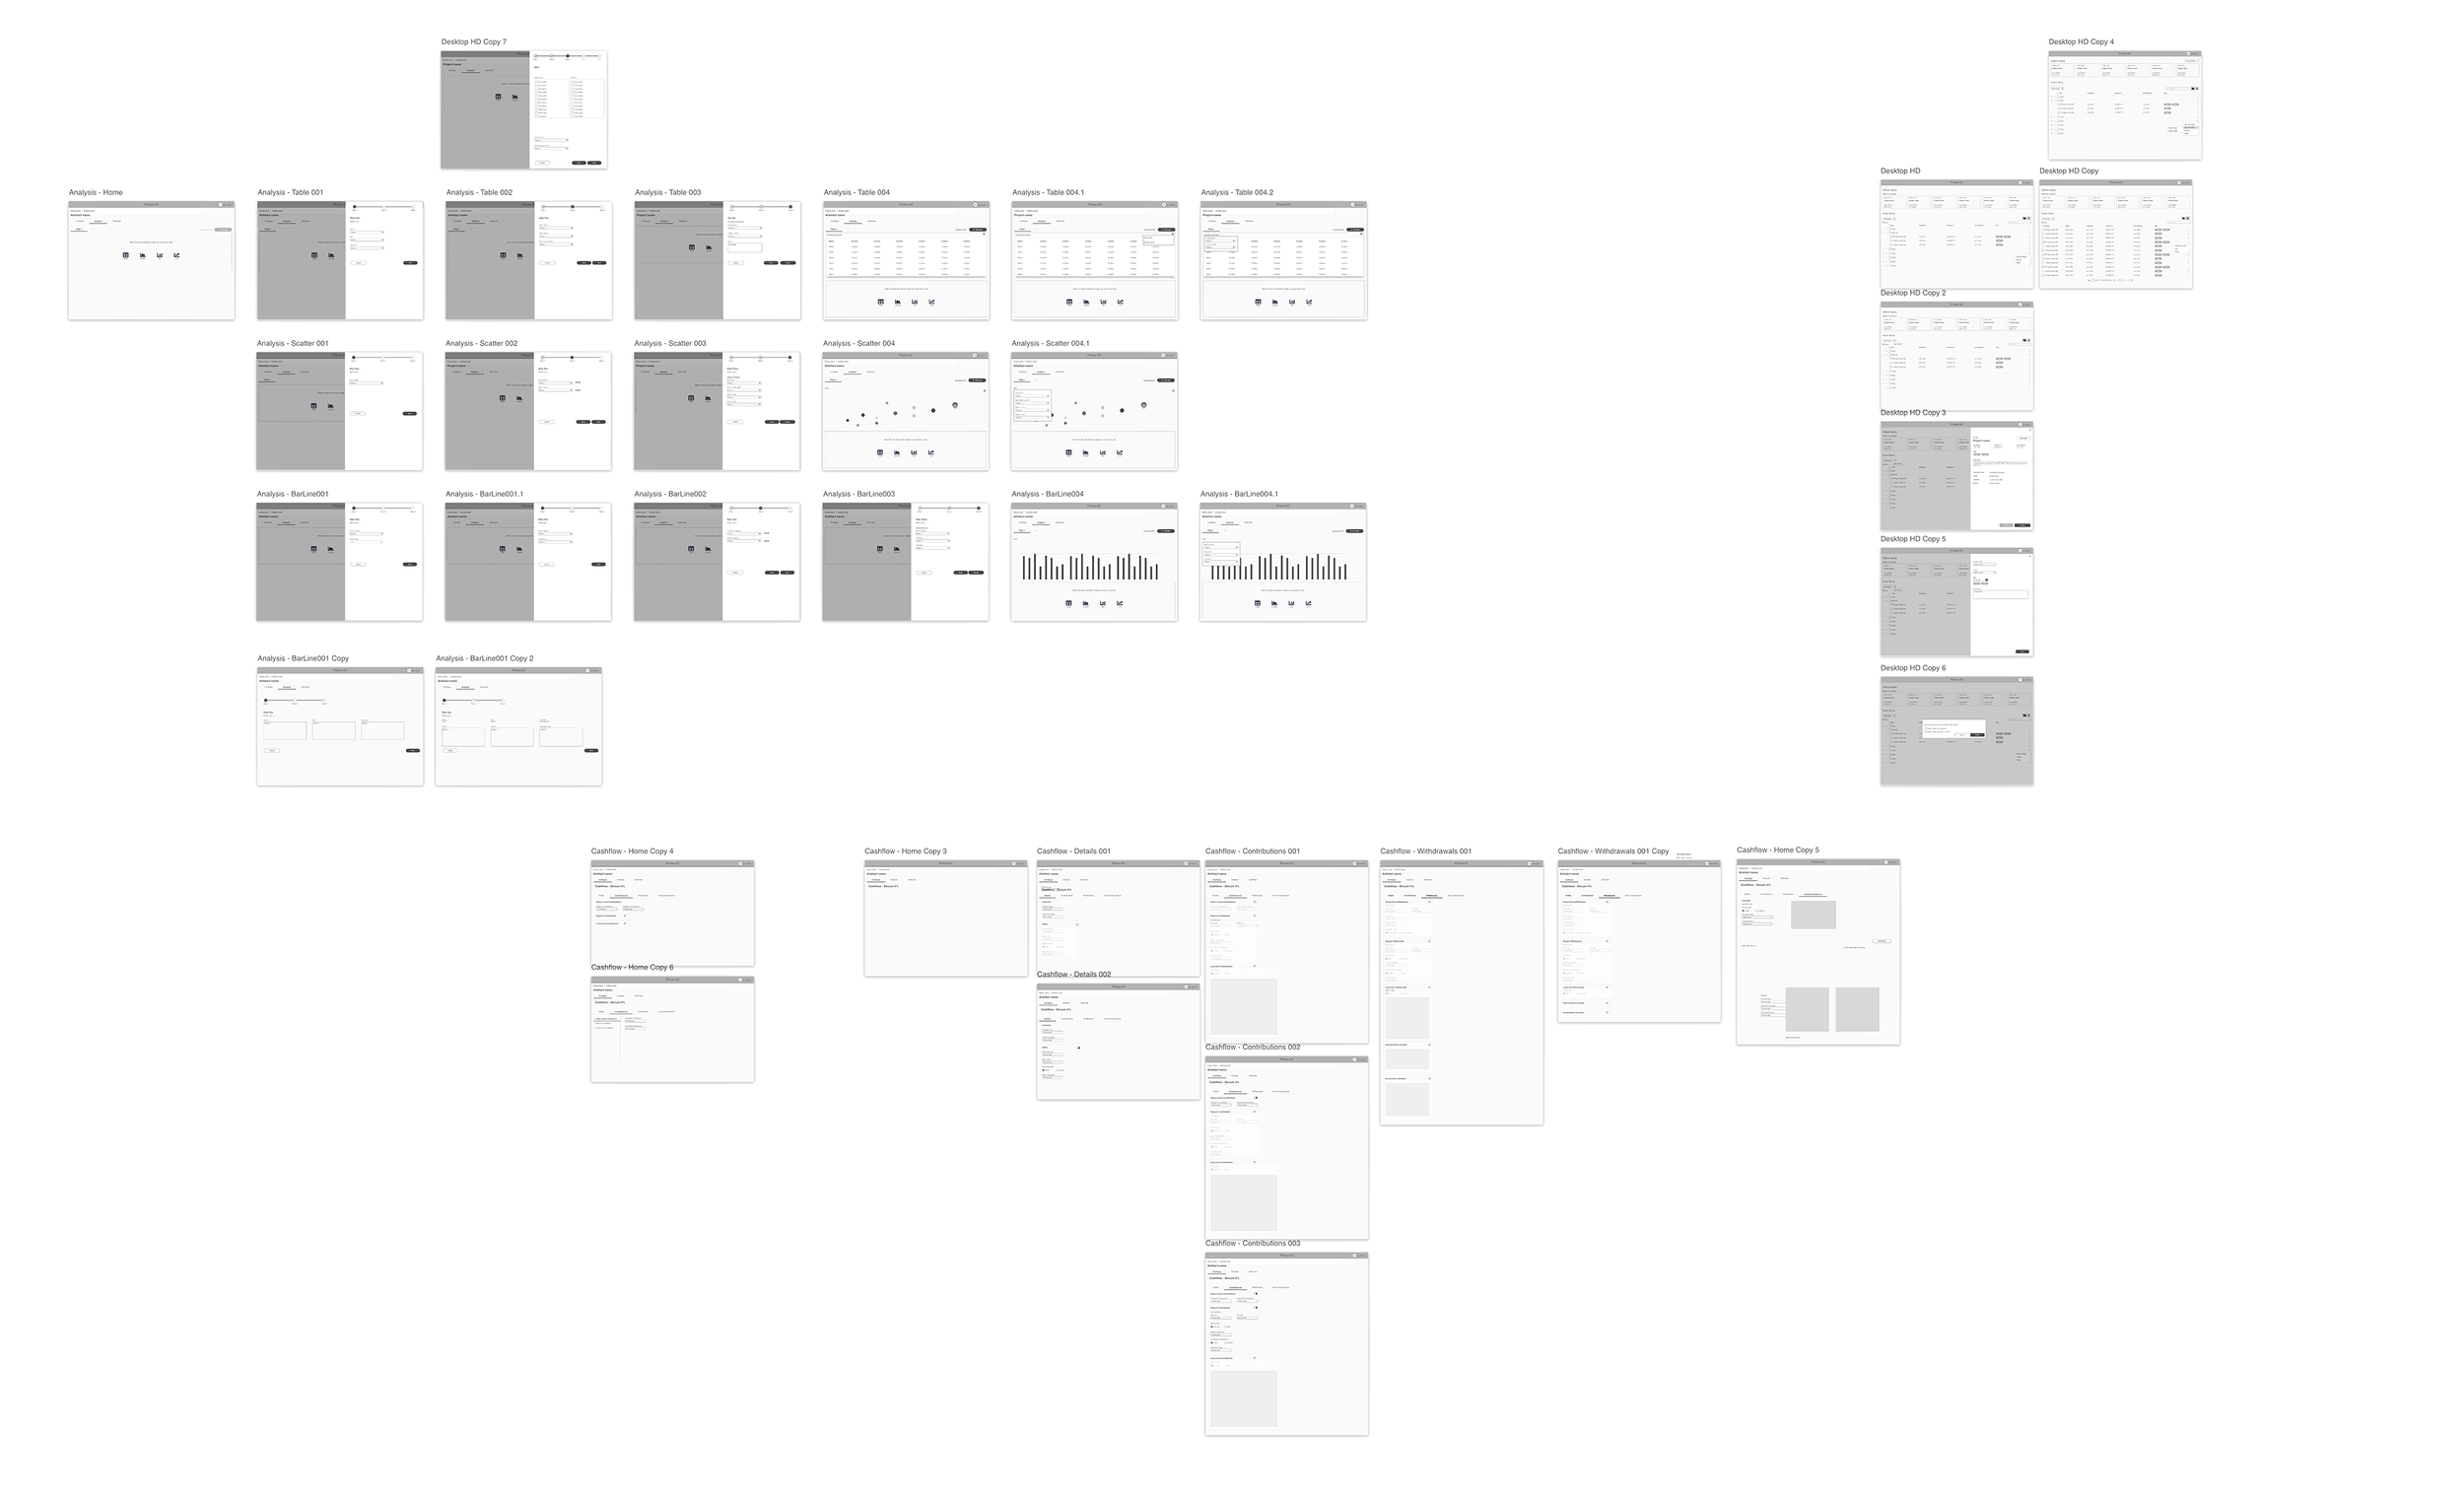
Once they had ran a projection, this would create what was called a ‘Data block’ which the user could use to create an Analysis page.
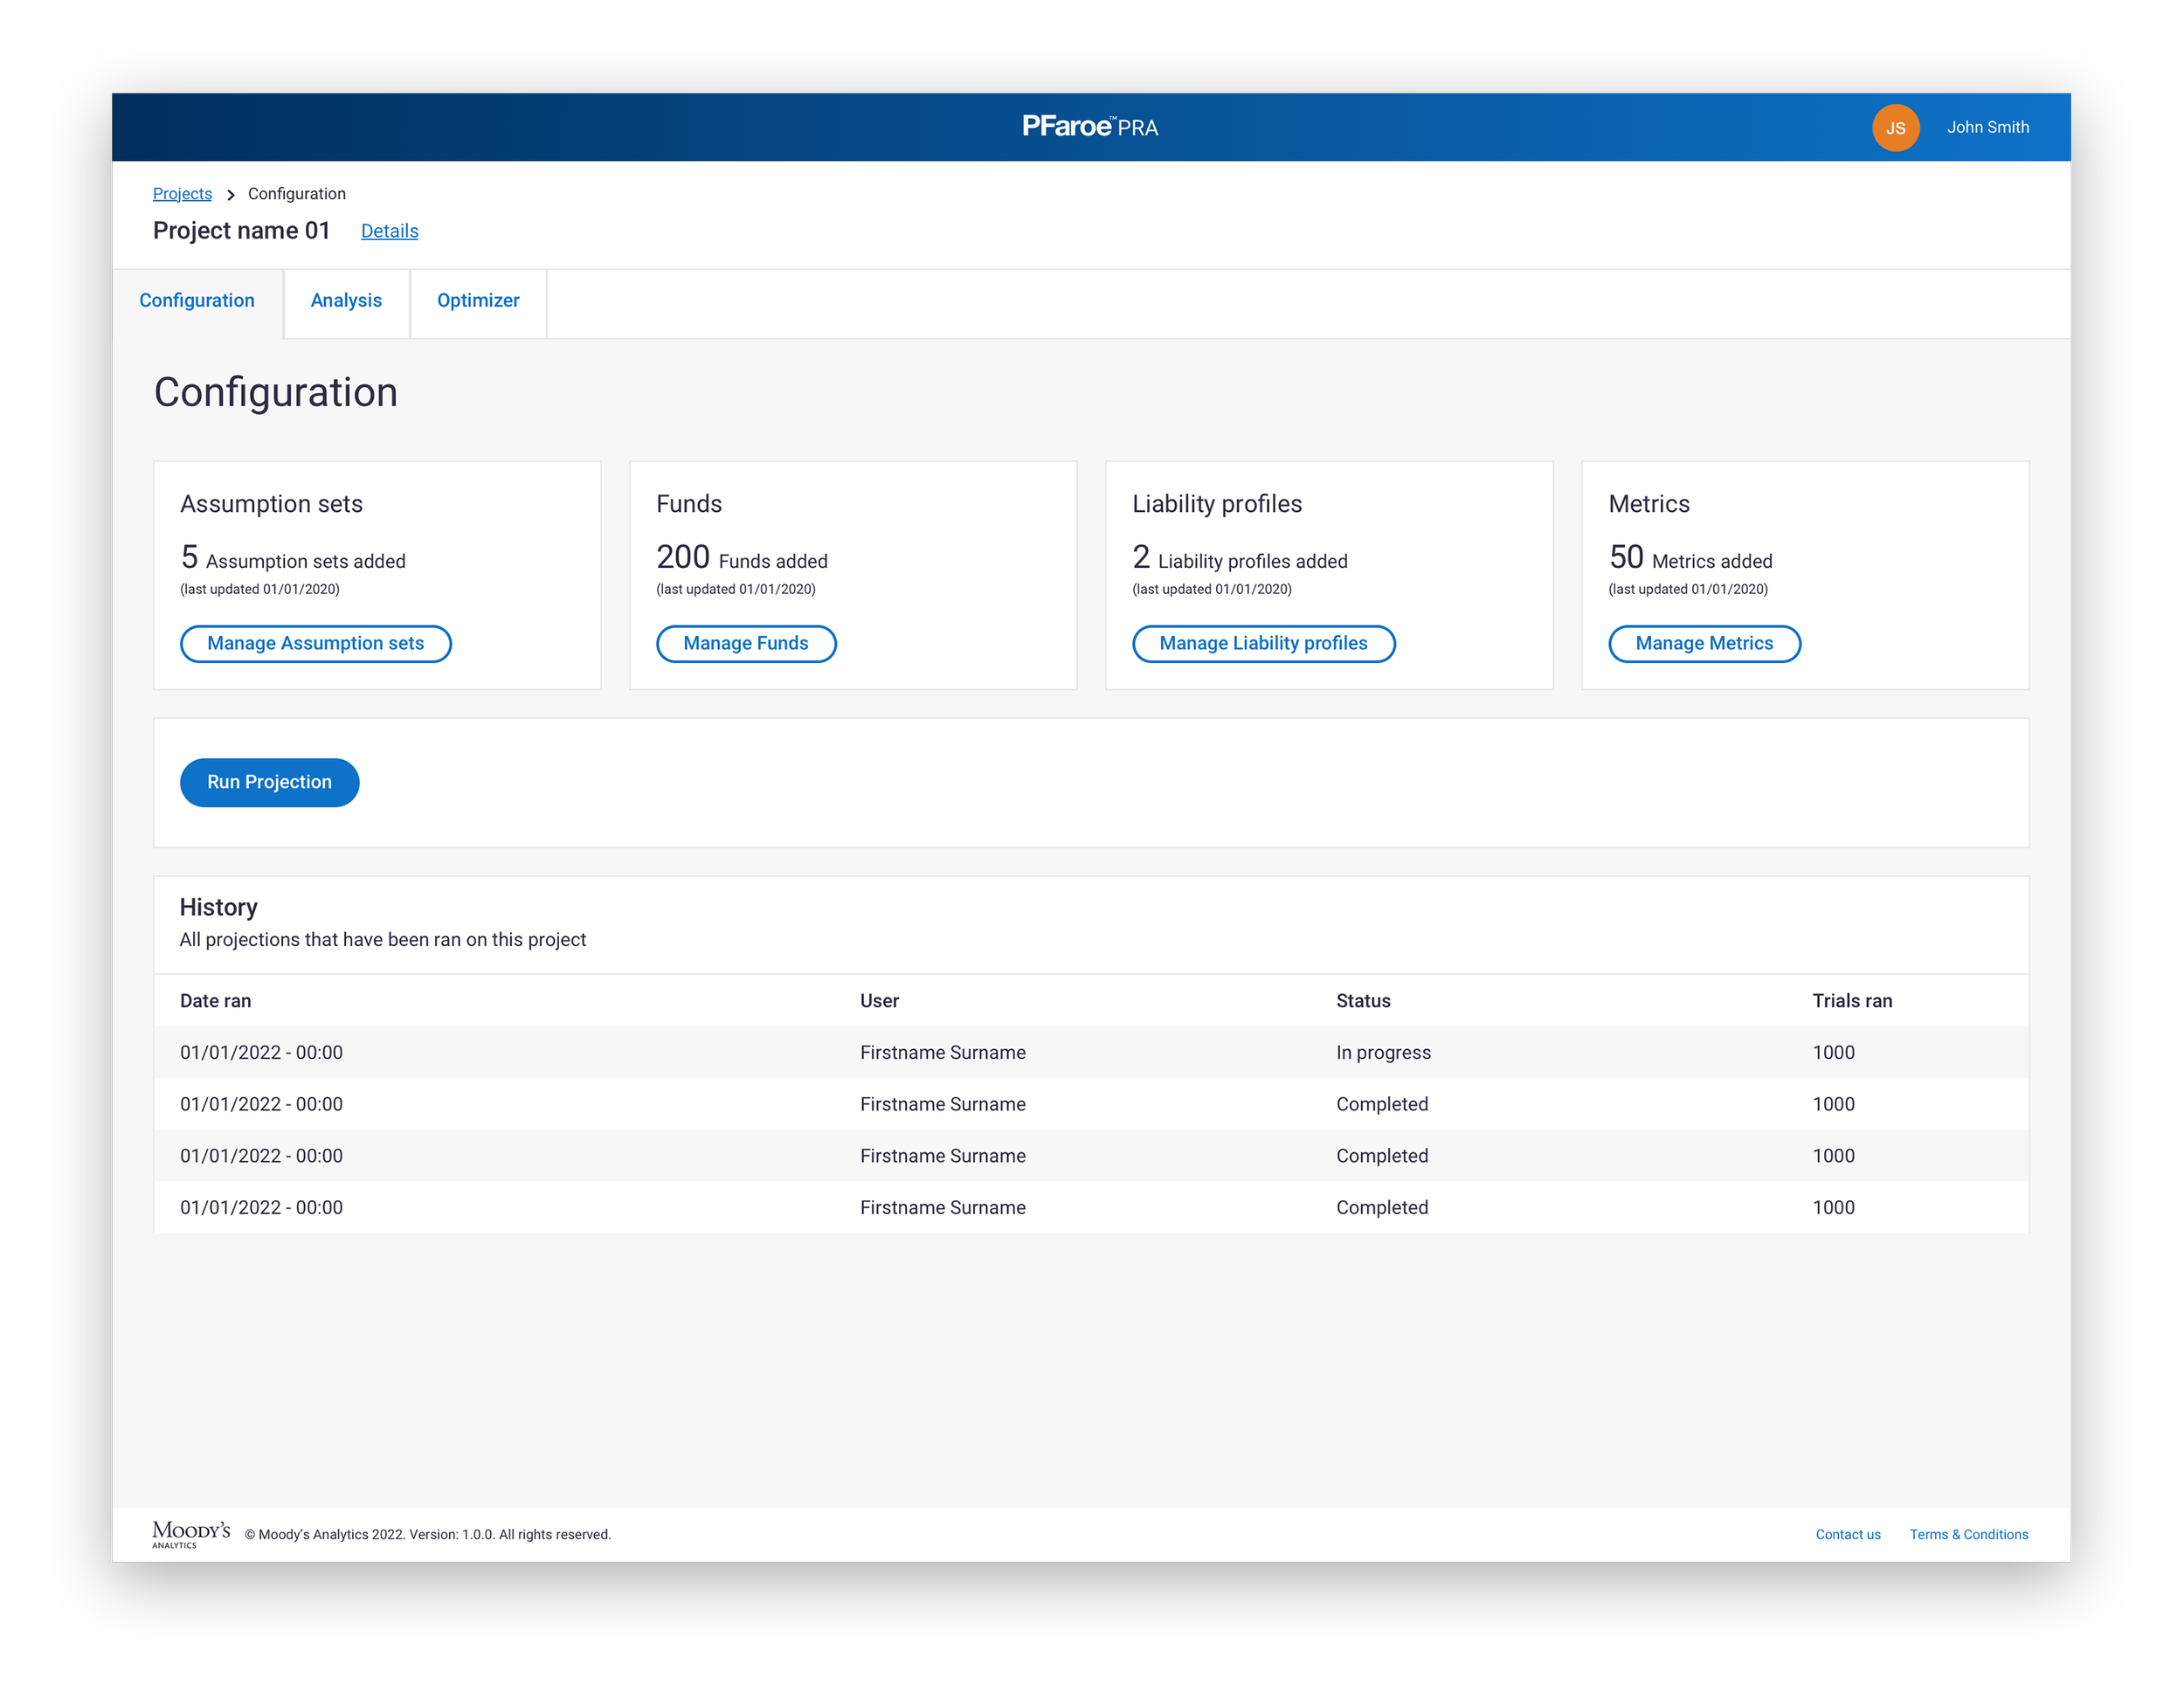
In order to successfully set up a project, these four areas had to be completed and each had their unique interaction due to the way they were set-up.
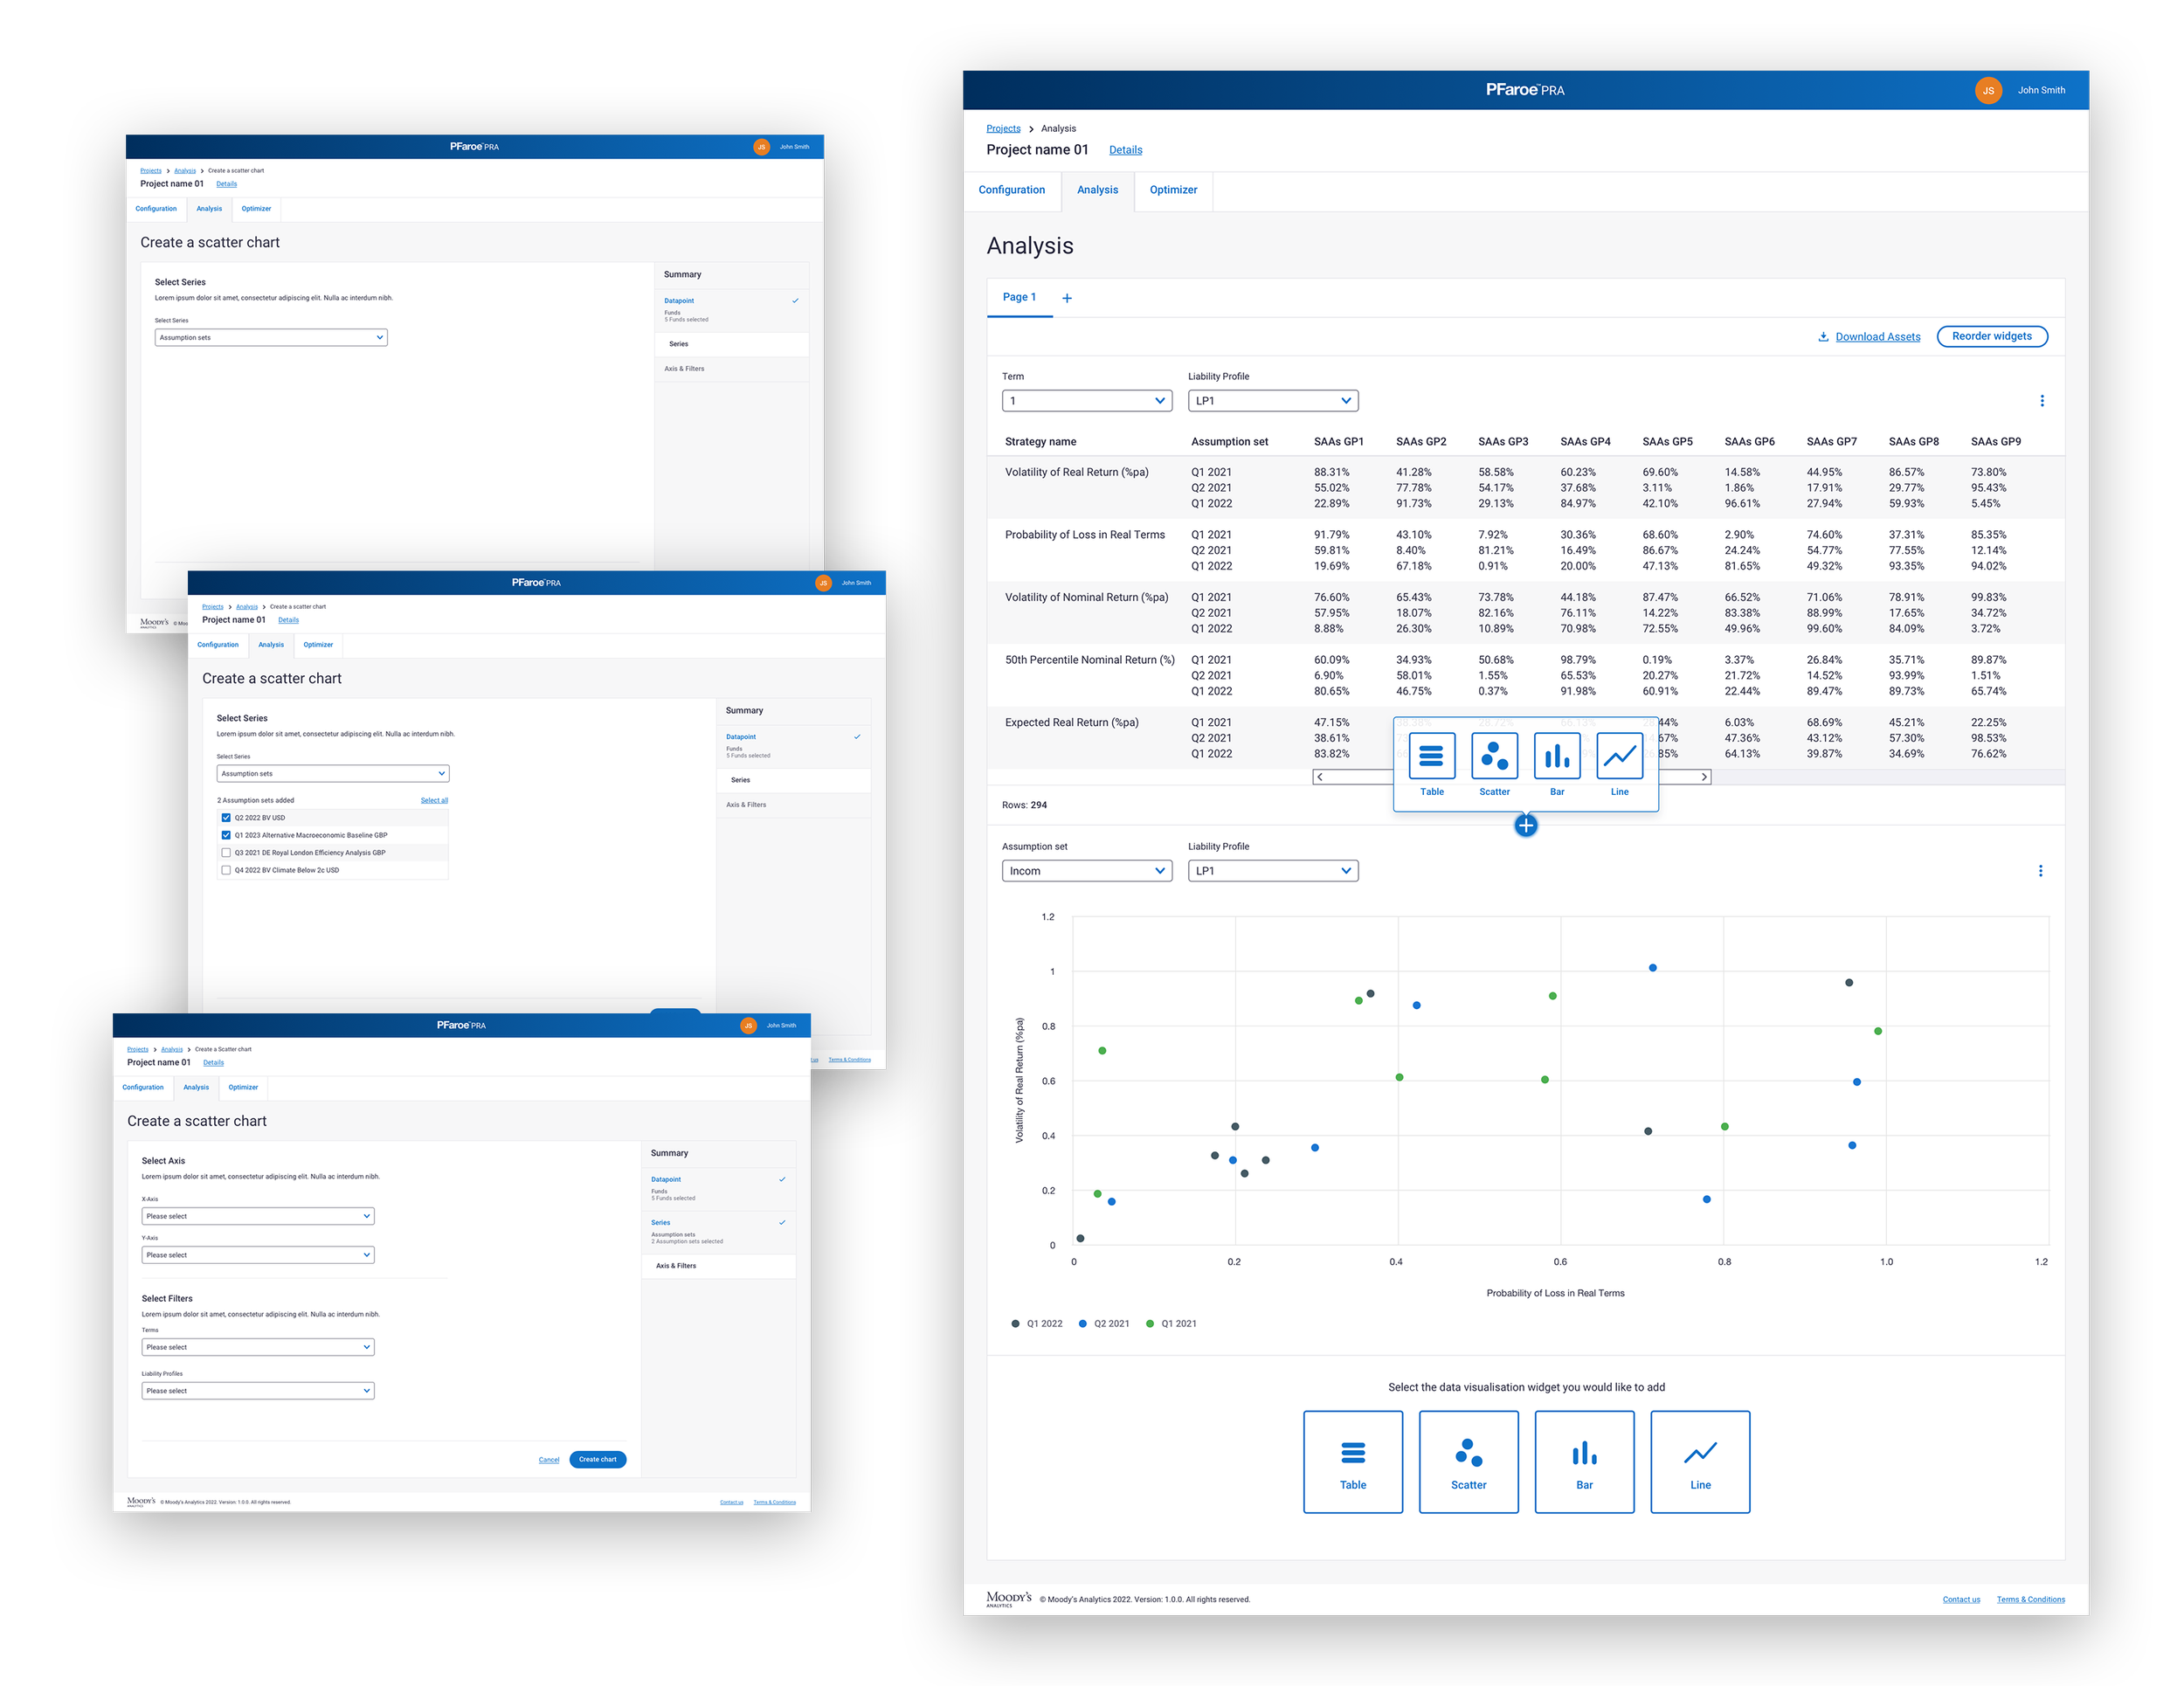
Analysis
The Analysis part allowed users to create custom dashboards, they could add a variety of graphs, charts and tables to the page, then in turn create downloadable reports that they could share with team members and decision makers.